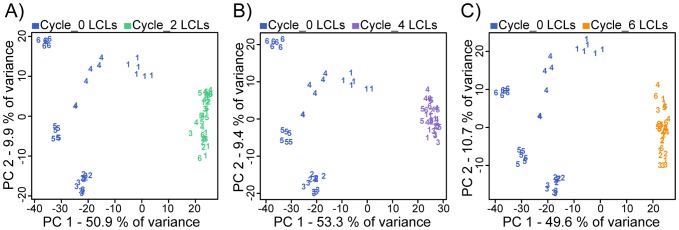
Figure 3. Individual effect on gene expression patterns.

PCA was applied to the genome-wide expression data of A) cycle 0 and cycle 2 B) cycle 0 and cycle 4 C) cycle 0 and cycle 6 LCL cultures. Numbers correspond to the individual origin of the culture (of the six individuals).
