
Figure 4. Gene expression variation in mature LCLs can observe only a fraction of the inter-individual variation in gene expression levels that exists in the primary B cells.
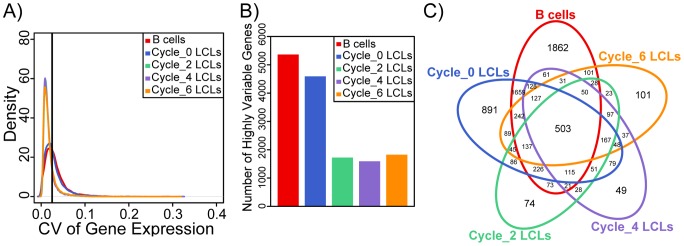
A) Density distributions of the coefficient of variation (CV) of gene expression between-individuals within primary B cells and within LCLs of each freeze-thaw cycle. Black vertical line designates the arbitrarily chosen threshold of CV of 0.025. B) Bar plots showing the numbers of genes classified as having ‘highly variable’ expression patterns in the primary B cells, cycle 0, cycle 2, cycle 4, and cycle 6 LCLs. C) Venn diagram of the overlaps in genes with ‘highly variable’ expression patterns across primary B cells, cycle 0, cycle 2, cycle 4, and cycle 6 LCLs. We also plotted an equivalent figure based on residual data after regressing out mtDNA and EBV copy numbers; see Figure S10 in in Appendix S1.