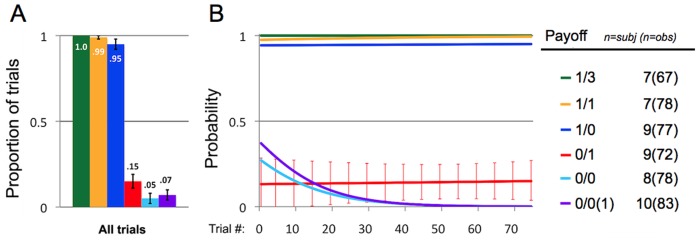
Figure 2. Data from Study 1.
(1A) Proportions of all trials during which actors pulled the handle to operate the apparatus, for each of payoff distribution. Error bars reflect one SE of the mean but do not control for non-independence, though models suggest there is little between-subjects behavioral variation (see Table S2). Numbers of subjects and observations are listed on the right. (1B) Logistic functions modeling the effect of Actor's Trial Number on the probability that Actors will pull the handle (see Table S4 for regression model estimates). These probabilities are comparable to the proportions from Figure 1A. Y-axis represents the probability that actors will pull the handle. X-axis represents the number of trials that an Actor has received previously (across all payoff distributions). Error bars around the red line (modeling the probability of pulling the handle for 0/1 trials) are estimated 95% confidence intervals, and control for non-independence.

