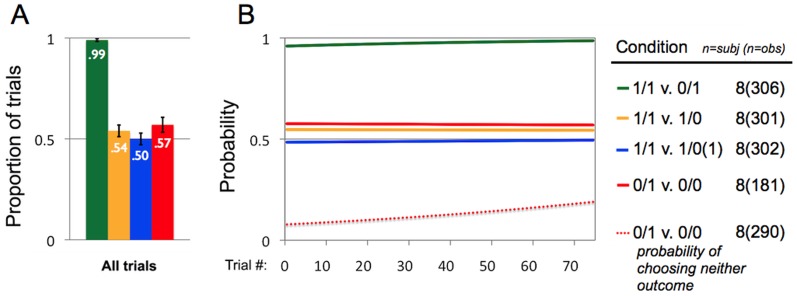
Figure 5. Data from Study 2.
(3A) Proportion of trials during which actors selected the prosocial outcome (for 1/1 v. 1/0, 1/1 v. 1/0(1), and 0/1 v. 0/0 conditions) or the self-maximizing outcome (for 1/1 v. 0/1), on trials where the Actor selected one of the two options. If Actors were indifferent to the payoffs obtained by recipients, they would be expected to pull the handle on half of the trials (proportion of .50). Numbers of subjects and observations are listed on the right. (3B) Logistic regressions representing the probability of actors' choices as a function of Actor's Trial Number (see Table S9 for regression model estimates). Solid lines depict the estimated probabilities that actors will select the prosocial or self-maximizing outcome, which are comparable to the proportions from Figure 3A. Y-axis represents the probability that actors will select the prosocial or self-maximizing outcome, and the x-axis represents the number of trials that an actor has received previously (across all payoff distributions/conditions). The red dotted line depicts the estimated probability that actors will do nothing (i.e., pull neither of the handles) in the 0/1 v. 0/0 condition (see Table S10 for regression model estimates).

