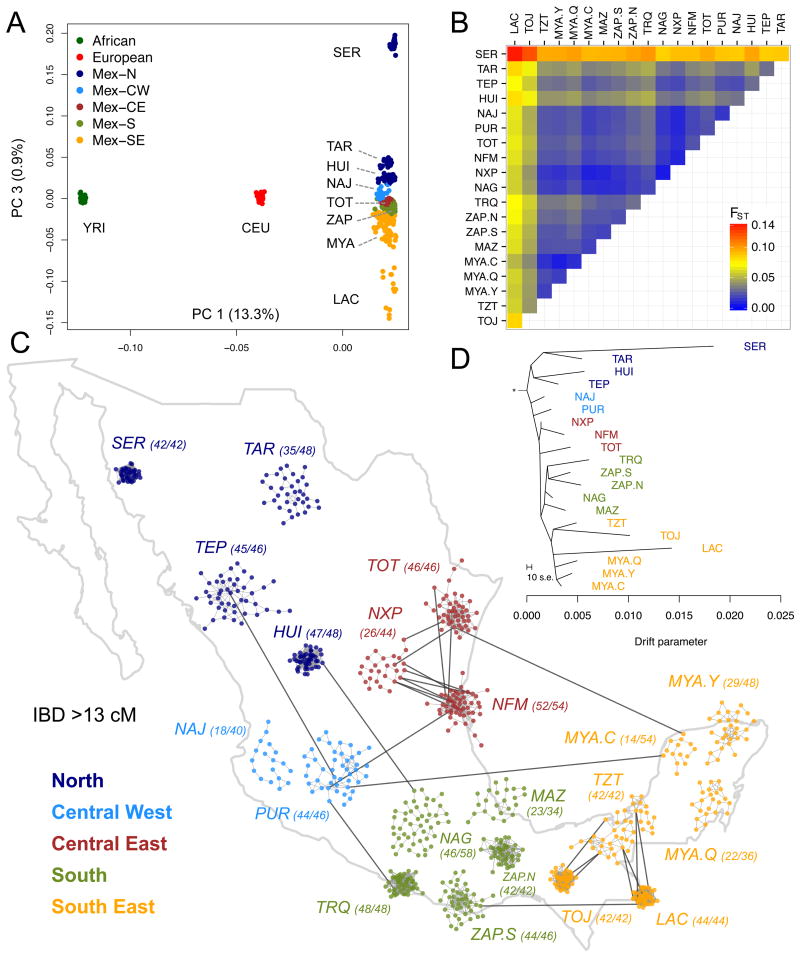
Fig. 1.
Genetic differentiation of Native Mexican populations. (A) Principal component analysis of Native Mexicans with HapMap YRI and CEU samples. Population labels as in Table S1. (B) Pairwise FST values among Native Mexican populations ordered geographically (see also Table S4). (C) Relatedness graph of individuals sharing more than 13 cM of the genome as measured by the total of segments identical-by-descent (IBD). Each node represents a haploid genome and edges within clusters attract nodes proportionally to shared IBD. The spread of each cluster is thus indicative of the level of relatedness in each population as determined by a force-directed algorithm. Only the layout of nodes within each cluster is the result of the algorithm, as populations are localized to their approximate sampling locations to ease interpretation. Parentheses indicate the number of individuals represented out of the total sample size (2N). The full range of IBD thresholds are shown in fig. S8. (D) TreeMix graph representing population splitting patterns of the 20 Native Mexican groups studied. The length of the branch is proportional to the drift of each population. African, European, and Asian samples were used as outgroups to root the tree (fig. S9).

