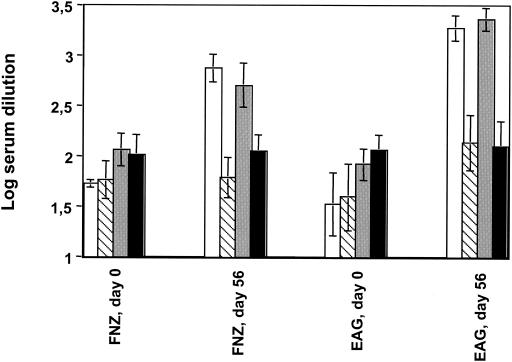
FIG. 7.
IgG antibodies in sera of immunized horses. The log dilution of sera required to give an absorbance value at a cutoff of 1.0 was calculated for each individual serum sample. Mean values (n = 3) with standard errors are shown. Samples taken before (day 0) and after (day 56) immunizations are shown. The horses, the same as described in the legend of Fig. 6, were divided into four groups: group A (white bars) received the antigens plus EtxB, given both s.c. and i.n.; group B (striped bars) received the same immunizations as group A but given only i.n.; group C (gray bars) received the same treatment as group A but without EtxB; and group D (black bars; control group) was given only EtxB both i.n. and s.c..

