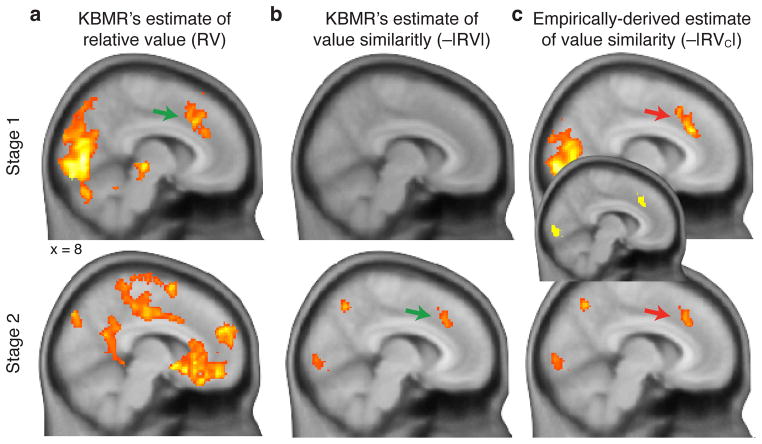
Figure 3. Experiment 1: Choice difficulty accounts for dACC activation in both stages of KBMR’s original task.
a) Whole-brain contrast for brain regions tracking KBMR’s estimate of the relative value of forage vs. engage options in Stage 1 (RVforage) (top), and the chosen vs. unchosen option in Stage 2 (bottom). b) Regions tracking the similarity of option values (i.e. −|RVforage|) for the same options represented in Panel a. We replicate the finding of significant dACC activity in the contrasts shown in the top panel of a and bottom panel of b (indicated with green arrow), consistent with the foraging value account. c) However, using an estimate of value similarity corrected to align with the behavioral data (i.e., −|RVforage-C| in Stage 1), the same region of dACC is found to be associated with choice difficulty in both Stage 1 and Stage 2 (red arrows). A conjunction of these two contrasts (shown in the center) indicates a large degree of overlap in dACC. Statistical maps in a–c are thresholded at voxelwise p<0.01, extent threshold of 200 voxels.

