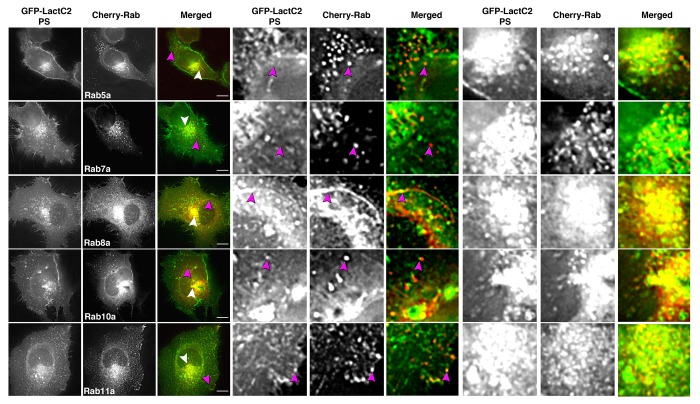
Figure 1. EGFP-LactC2 (PS) and mCherry-Rab GTPases in live HeLa cells show distinct patterns of overlap. HeLa cells expressing EGFP-LactC2 and mCherry-Rab proteins were imaged with live cell deconvolution microscopy for at least 1 min every 2 s. Rab5a and Rab7a showed limited overlap with LactC2 in the periphery of cells while Rab8a and Rab11a display consistent overlap with mCherry-LactC2 throughout the cell. Rab10 overlap with LactC2 was present but not consistent over multiple experiments. Data represent at least 3 independent experiments. Bars, 10 μm

An official website of the United States government
Here's how you know
Official websites use .gov
A
.gov website belongs to an official
government organization in the United States.
Secure .gov websites use HTTPS
A lock (
) or https:// means you've safely
connected to the .gov website. Share sensitive
information only on official, secure websites.
