
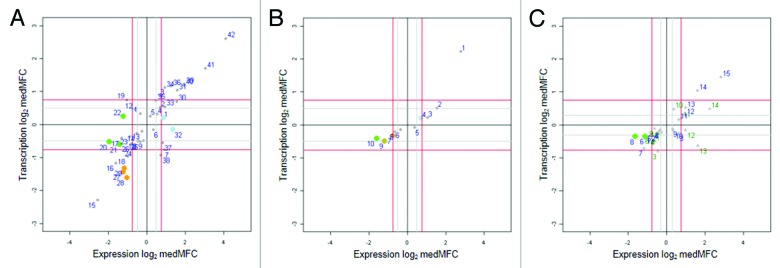
Figure 2. Multiple regulatory patterns involve modulation of transcription and/or mRNA turnover. Genes with good fits to one of three mathematical models are classified by Bayesian hierarchical clustering. The resulting clusters are plotted as a function of their median maximum-fold change values for expression (medMFCEXP) and for Pol II occupancy (medMFCPOL). Orange dots represent clusters enriched for ribosomal proteins. Blue dots represent clusters regulated mainly at the mRNA stability level. Green dots are clusters enriched for genes of the Ribi regulon. (A) Clusters derived from genes assigned to the ‘constant’ model (1c-42c). (B) Clusters derived from genes assigned to the ‘constant’ model with exponential approach to a new steady-state (1e-10e). (C) Clusters derived from genes assigned to the ‘switch’ model (stabilized, 1ss-14ss, triangles; destabilized, 1ds-15ds, circles).