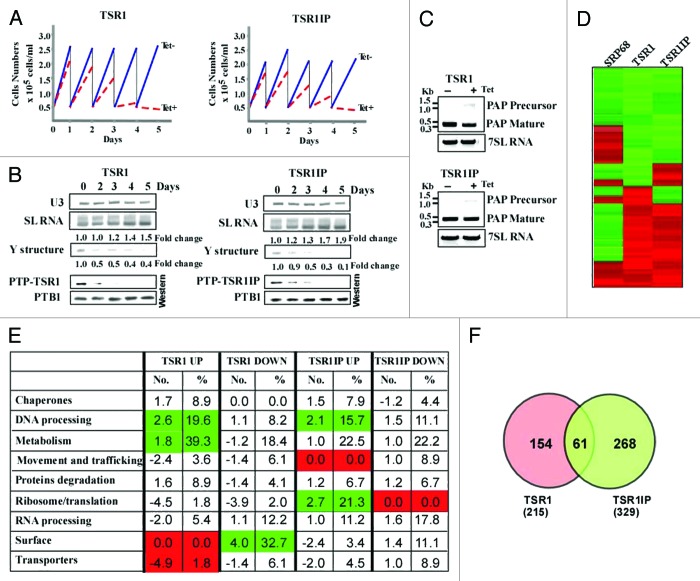
Figure 1. TSR1 and TSR1IP are required for trans- and cis-splicing. (A) Growth curves of T. brucei cells silenced for TSR1 and TSR1IP. Growth of uninduced cells was compared with growth after tetracycline addition. Both uninduced and induced cultures were diluted daily to 5 × 10⁴ cells per ml. (B) TSR1 and TSR1IP silencing affects trans- splicing. Cells expressing either the PTP-TSR1 and TSR1 silencing constructs, or PTP-TSR1IP and TSR1IP silencing constructs were silenced for the number of days indicated. Upper panel: Total RNA (10 µg) from the same cells was subjected to primer extension with an oligonucleotide complementary to the intron region of the SL RNA (S-1). Primer extension of U3 was used to determine the amount of RNA used. The products were separated on a 6% acrylamide denaturing gel. The results were quantified using ImageJ. The levels of SL RNA and Y structure intermediate are given as fold change with respect to the amount present at day 0, and were normalized to the level of U3 snoRNA. Lower panel: Proteins (from 107 cells) were extracted from the silenced cells at the time points indicated, separated on a 10% SDS polyacrylamide gel, and subjected to western analysis. Reactivity with PTB1 antibodies was used as a control for equal loading. (C) cis-splicing of PAP in TSR1 and TSR1IP silenced cells. RNA was prepared from uninduced cells, or after 2 d of induction. cDNA was prepared, and subjected to PCR amplification with oligonucleotides specific to the mature or pre-PAP transcript. The level of 7SL RNA was used to control for equal loading of cDNA. (D) Heat map of the transcriptome of TSR1, TSR1IP, and SRP68 silenced cells. Transcripts that differed from the control by > 1.5-fold change (P value < 0.05) were chosen for the analysis. Each column represents the average of seven biological replicates. The diagram represents the differential expression or fold change according to the following color scale: red, upregulated genes; green, downregulated genes (see Materials and Methods). (E) Functional enrichment analysis of gene sets of down and upregulated genes during TSR1 and TSR1IP silencing. The genes presented in Table S2 were categorized based on the gene ontology presented in the figure, as previously described.27 The fold change of each category is given, comparing the percentage of a category in the regulated genes to the percentage of the same category in the data set (Table S2). The percentage of the genes in each category among the regulated genes is also given. Green or red represent categories that were significantly enriched (Fisher exact test, one side P value < 0.05) in comparison to the whole genome annotation (in total, we identified 1493 genes in the “genome” with annotations). (F) Venn diagrams illustrating overlaps between TSR1 and TSR1IP regulated genes.

An official website of the United States government
Here's how you know
Official websites use .gov
A
.gov website belongs to an official
government organization in the United States.
Secure .gov websites use HTTPS
A lock (
) or https:// means you've safely
connected to the .gov website. Share sensitive
information only on official, secure websites.
