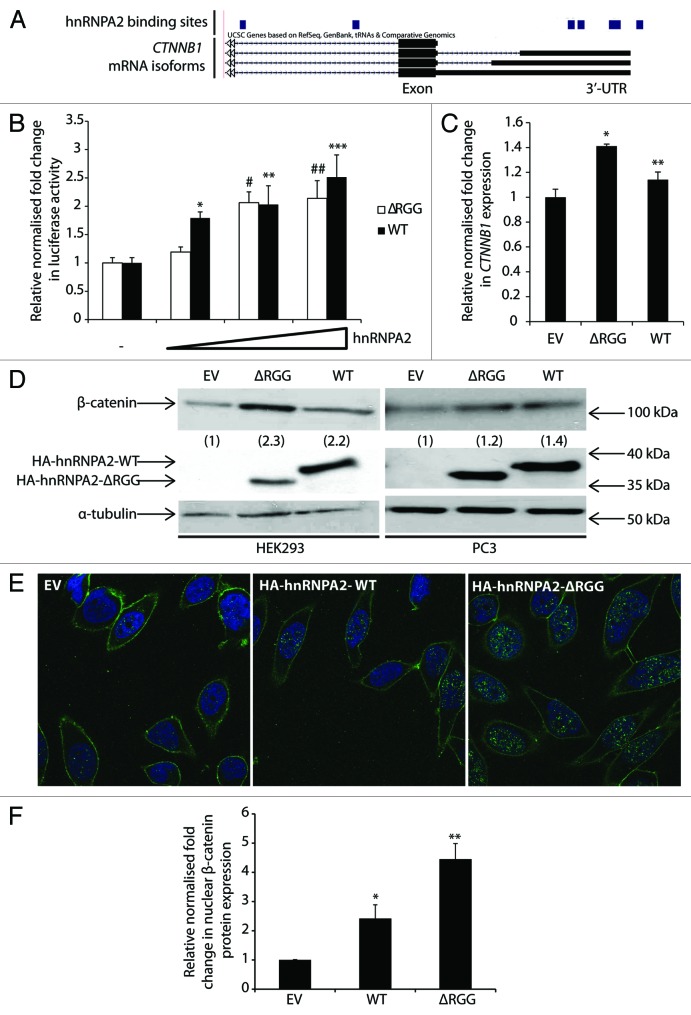
Figure 4. hnRNPA2 acts on the 3′-UTR of CTNNB1 mRNA resulting in an increased β-catenin protein expression. (A) UCSC Genome Browser showing transcript details for CTNNB1. Custom track showing locations of hnRNPA2 binding sites in 293T cells.14 (B) HEK293 cells were transfected with either pMiR-report-β-catenin-3′-UTR or pMiR-report-empty vector and pRL-null reporters, and HA-tagged wild-type (WT) hnRNPA2 or hnRNPA2-ΔRGG (50 ng, 100 ng, or 200 ng) or empty vector (EV). After 48 h cells were harvested for luciferase activity analysis, and data normalized to activity of pRL-null (DNA transfection control) vector as well as pMiR-report-empty (luciferase expression control) vector. Data from at least three independent experiments with at least three technical replicates were used to calculate the means ± SE (*P = 0.001, **P = 0.02, ***P = 0.009, #P = 0.002, ##P = 0.01). (C) HEK293 cells transfected with 2 µg of plasmid DNA vectors encoding HA-tagged WT hnRNPA2 or hnRNPA2-ΔRGG. qRT-PCR was performed on cDNAs from two independent experiments, and levels of CTNNB1 transcript expression were normalized to a mean of CASC3 and ACTB levels to obtain mean relative normalized fold change ± SE (*P = 0.006, **P = 0.04). (D) HEK293 (left panel) PC3 (right panel) cells transfected with 2 µg of plasmid DNA vectors encoding HA-tagged WT hnRNPA2 or hnRNPA2-ΔRGG using antibodies to HA tag and β-catenin. Western analysis images shown are representative of three independent experiments, from which densitometric band quantitation was performed to calculate the mean relative normalized fold change in total β-catenin protein expression (shown in brackets). (E) PC3 cells were transfected with 2 µg of plasmid DNA vectors encoding HA-tagged WT hnRNPA2 or hnRNPA2-ΔRGG and images captured by confocal laser scanning microscopy using indirect immunofluorescence and antibody to β-catenin (green) and a DAPI nuclear counterstain (blue). Indirect immunofluorescence images shown are representative of two fields of view, from which densitometric fluorescence quantitation was performed to calculate means relative normalized fold-change in β-catenin nuclear protein expression ± SD (All P values shown are for comparisons with control conditions).

An official website of the United States government
Here's how you know
Official websites use .gov
A
.gov website belongs to an official
government organization in the United States.
Secure .gov websites use HTTPS
A lock (
) or https:// means you've safely
connected to the .gov website. Share sensitive
information only on official, secure websites.
