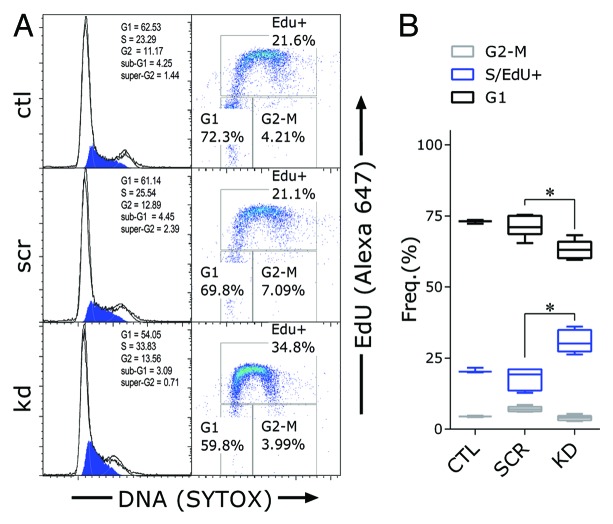
Figure 3. Effect of HOTAIRM1 knockdown on cell proliferation and cell cycle progression at day 4 of ATRA-induced granulocytic differentiation of NB4 cells. (A) Left panels: Representative cell cycle model analysis of DNA content histograms (S phase shaded in blue); Right panels: EdU incorporation vs. DNA scatter plots; (B) Cell cycle phase distribution of G1 (EdU negative), S (EdU positive), and G2/M (EdU negative) in knockdown and control NB4 cells, determined by gating on EdU vs DNA scatter plots. Boxes represent 25th to 75th percentiles, with means indicated by an interior horizontal line and ranges by upper and lower brackets (n = 3–9; * P < 0.05, two-way ANOVA Holm–Sidak post-hoc test). ctl, non-transduced control; scr, scramble control; kd, HOTAIRM1-knockdown cells.

An official website of the United States government
Here's how you know
Official websites use .gov
A
.gov website belongs to an official
government organization in the United States.
Secure .gov websites use HTTPS
A lock (
) or https:// means you've safely
connected to the .gov website. Share sensitive
information only on official, secure websites.
