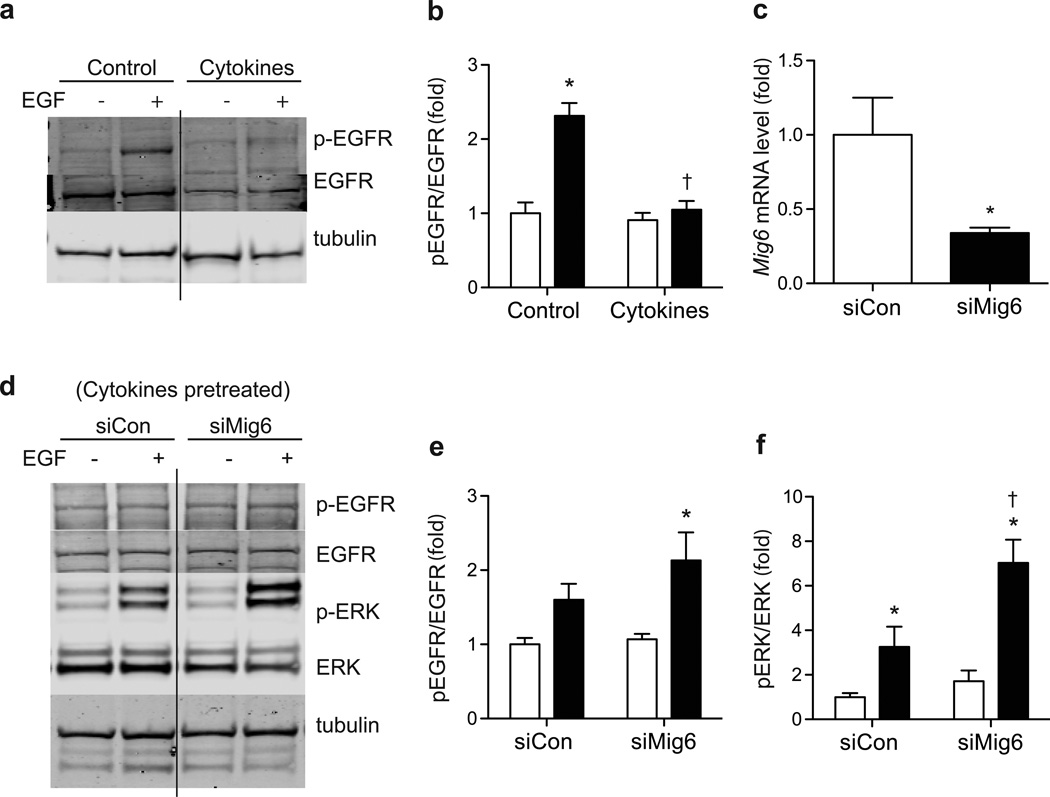
Fig. 2.
MIG6 suppression rescues cytokine inhibition of EGFR. 832/13 cells were pretreated with cytokines for 16 h and then stimulated with EGF to determine phospho (p)-EGFR, EGFR and tubulin levels: (a) a representative image and (b) quantified results (white bars, no EGF; black bars, EGF treated). n=3, *p<0.05 vs untreated, †p<0.05 vs noncytokine EGF stimulated. The solid line indicates cropped lanes within the same experiment. (c–f) 832/13 cells were transduced with adenoviral vectors carrying either a scrambled control RNA (siCon) or shRNA sequence against Mig6 (siMig6). (c) MIG6 knockdown efficiency was determined. n=3, *p<0.05 vs siCon. Following transduction, cells were treated with cytokines for 8 h and then EGF, and p- EGFR, EGFR, p-ERK, ERK and tubulin levels were determined: (d) a representative image and (e–f) quantified results. n=3; *p<0.05 vs untreated, †p<0.05 vs siCon EGF stimulated

