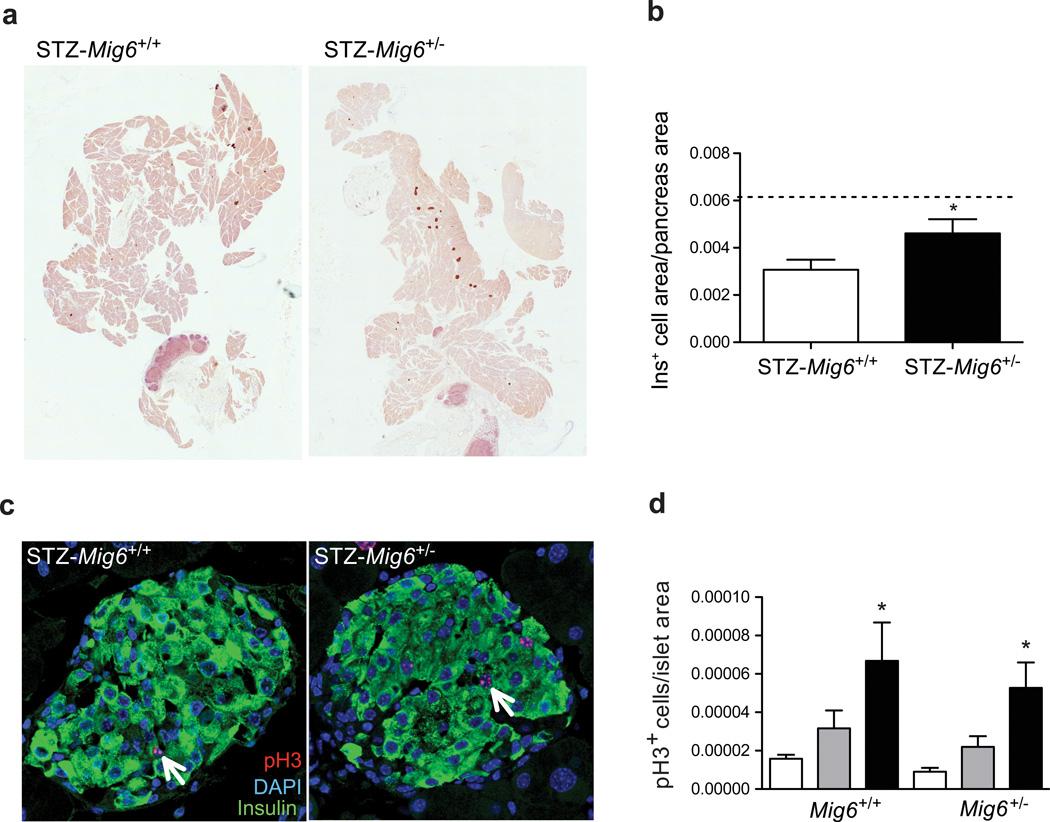
Fig. 8.
STZ-Mig6+/− mice show enhanced beta cell mass recovery. (a, b) Beta cell area was measured and expressed relative to pancreas area. Dotted line indicates the beta cell area of non-STZ-treated mice. n=8, *p<0.05 vs STZ-Mig6+/+. (c, d) The percentage of pH3-positive (pH3+) beta cells in saline controls (white bars) and at 3 and 20 days post-STZ (grey and black bars, respectively). Arrows indicate proliferating beta cells. n>5, *p<0.05 vs non-STZ. (a, c) Representative images of beta cell mass at 20 days

