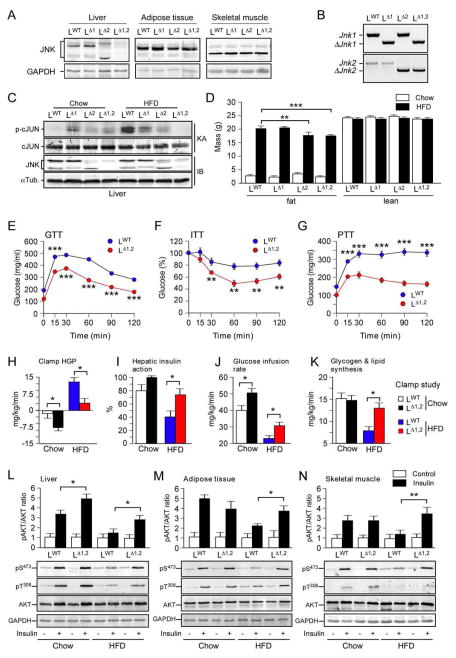
Figure 1. Hepatic JNK contributes to diet-induced obesity and insulin resistance.
(A) The liver, adipose tissue (epididymal), and skeletal muscle (gastrocnemius) of LWT, LΔ1, LΔ2 and LΔ1,2 mice were examined by immunoblot analysis by probing with antibodies to JNK and GAPDH.
(B) Genomic DNA isolated from the liver of LWT, LΔ1, LΔ2 and LΔ1,2 mice was examined by PCR analysis to detect Jnk and ΔJnk alleles.
(C) Liver extracts prepared from mice fed a chow diet or a HFD (16 wk) and starved overnight were examined by immunoblot (IB) analysis by probing with antibodies to αTubulin and JNK. In vitro protein kinase assays (KA) with the substrates GST-cJun and [γ-32P]ATP were performed to measure JNK activity. The amount of cJun and phosphorylated cJun (p-cJun) were detected by staining with Coomassie blue and Phosphorimager (Applied Biosystems) analysis, respectively.
(D) The fat and lean mass of chow-fed and HFD-fed (16 weeks) mice were measured by 1H-MRS analysis (mean ± SEM; n = 8 ~ 10). Significant differences between LWT and LΔ1,2 mice were detected (**, p < 0.01, ***, p < 0.001).
(E,F) Glucose (GTT) and insulin (ITT) tolerance tests were performed on mice fed (16 wk) a HFD (mean ± SEM; n = 35 ~ 50; **, p < 0.01; ***, p < 0.001).
(G) Pyruvate (PTT) tolerance tests were performed on mice fed (16 wk) a HFD (mean ± SEM; n = 20 ~ 30; *, ***, p < 0.001).
(H–K) Insulin sensitivity was measured using hyperinsulinemic-euglycemic clamps with conscious LWT and LΔ1,2 mice fed a chow diet or HFD. The hepatic glucose production (HGP) during the clamp, hepatic insulin action (expressed as insulin-mediated percent suppression of basal HGP), glucose infusion rate, and glycogen plus lipid synthesis (mean ± SEM for 6 ~ 8 experiments) are presented. Statistically significant differences between LWT and LΔ1,2 mice are indicated (* p < 0.05).
(L–N) Chow-fed or HFD-fed LWT and LΔ1,2 mice were starved overnight and then administered insulin (1.5U/kg body mass) by intraperitoneal injection. Liver, epididymal adipose tissue, and gastrocnemius muscle extracts (prepared 15 mins post-injection) were examined (upper panels) by multiplexed ELISA for pS473-AKT and AKT (mean ± SEM; n = 5 ~ 6; *, p < 0.05). Representative extracts were also examined by immunoblot analysis using antibodies to AKT, phospho-AKT (pSer473 and pThr308) and GAPDH (lower panels).
See also Figures S1 & S2.

