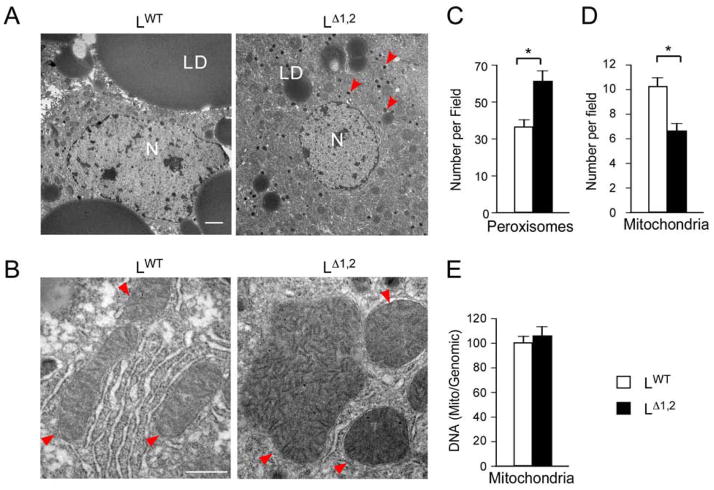
Figure 4. Hepatic JNK-deficiency increases peroxisome number and mitochondrial size.
(A, B) LWT and LΔ1,2 mice were fed a HFD (16 wks). Sections of the liver were examined by transmission electron microscopy. Representative images are presented. Key: nucleus (N); lipid droplet (LD). Arrow heads indicate peroxisomes (A) and mitochondria (B). Bar, 2 μm (A) and 0.5 μm (B).
(C, D) The number of peroxisomes (C) and mitochondria (D) per field was measured (mean ± SEM; n = 30; *, p < 0.05).
(E) Relative mitochondrial DNA copy number was measured (mean ± SEM; n = 3).

