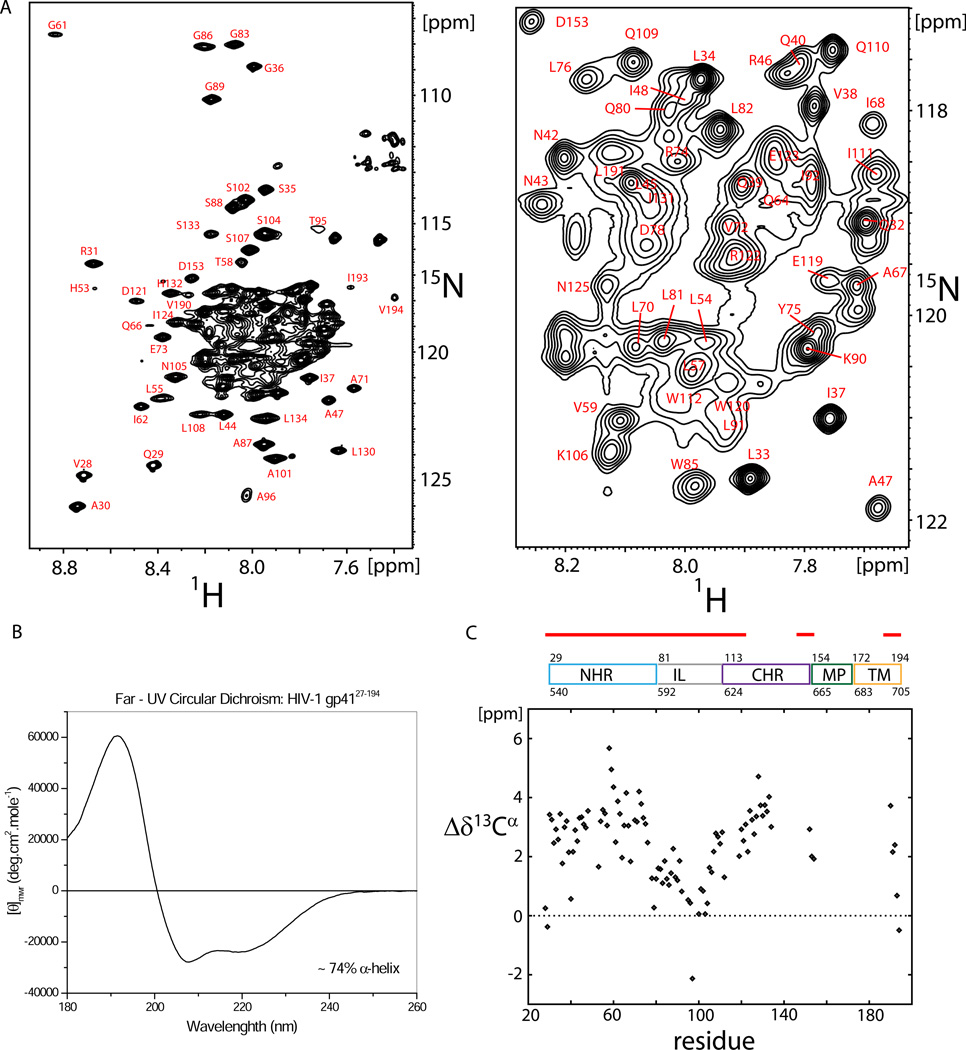
Figure 1. Secondary structure propensity of gp4127–194.
a) 800 MHz 15N-1H TROSY-HSQC spectrum of 1.0 mM 2H15N13C gp4127–194 in DPC micelles, 50mM sodium acetate, pH 4.0, 25 mM KCl, recorded at 40 °C (left) and where the most crowded region has been magnified for clarity (right). b) Far-UV spectrum of gp4127–194. The mean residue ellipticity θmwr [degrees cm2mol–1] is plotted versus the wave length [nm]. c) 13Cα secondary chemical shifts of gp4127–194 in DPC micelles.

