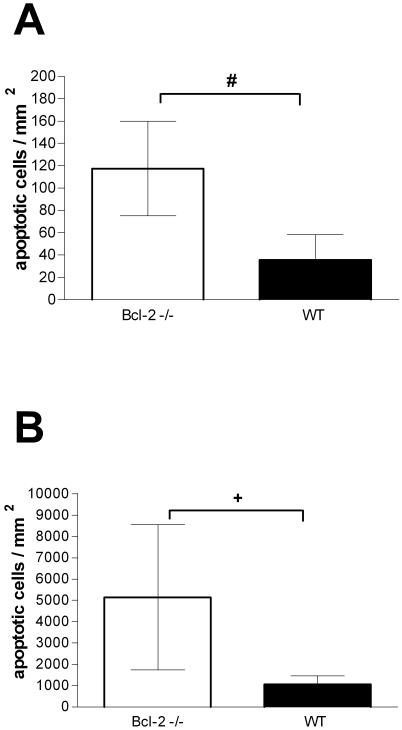
FIG. 1.
Numbers of apoptotic lymphocytes in spleen follicles in Bcl-2-deficient mice (open bars) and controls (wild type [WT]) (solid bars). (A) Results 36 h after intracerebral injection of 25 μl of saline (n = 3 and n = 4 for the Bcl-2-deficient mice and controls, respectively). (B) Results 36 h after intracerebral injection of 104 CFU of S. pneumoniae in 25 μl (n = 8 and n = 9 for the Bcl-2-deficient mice and controls, respectively). Note the difference in the scales of the ordinate axes. The bars indicate means, and the error bars indicate standard deviations. A number sign indicates that the P value is 0.02, and a plus sign indicates that the P value is <0.005 (as determined by a t test).

