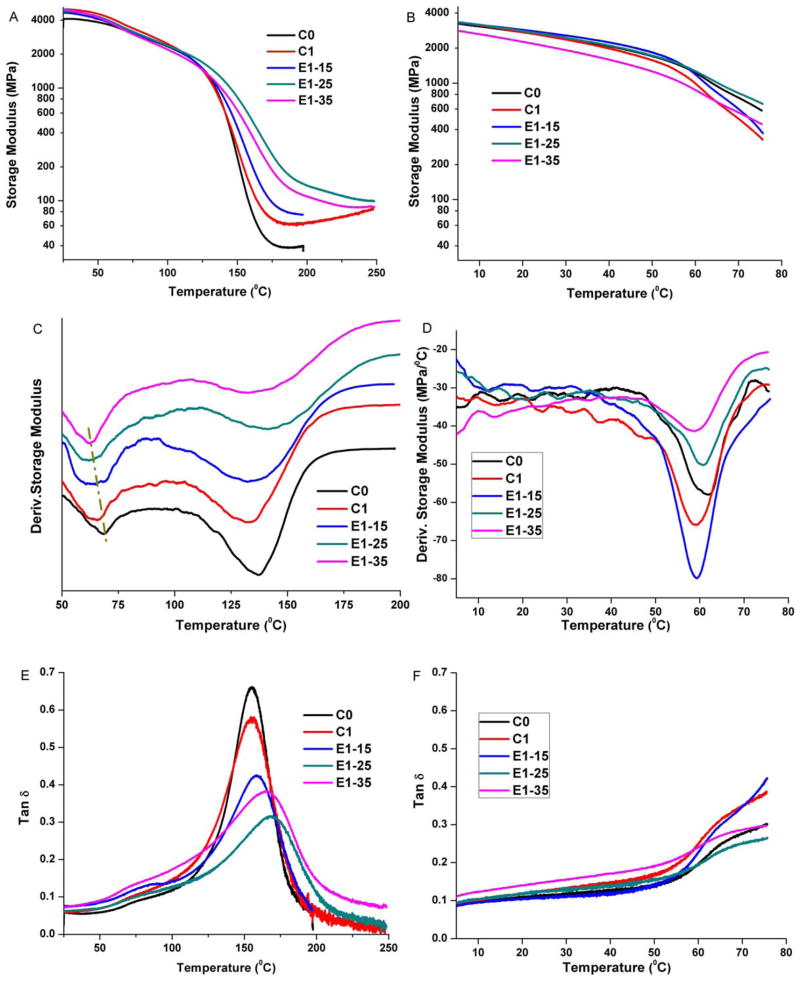
FIGURE 7.
Representative storage modulus (A and B), derivative storage modulus (C and D), and tan δ (E and F) versus temperature curves of the control and experimental adhesive copolymers in dry (A, C, and E) and wet (B, D, and F) condition. [Color figure can be viewed in the online issue, which is available at wileyonlinelibrary.com.]

