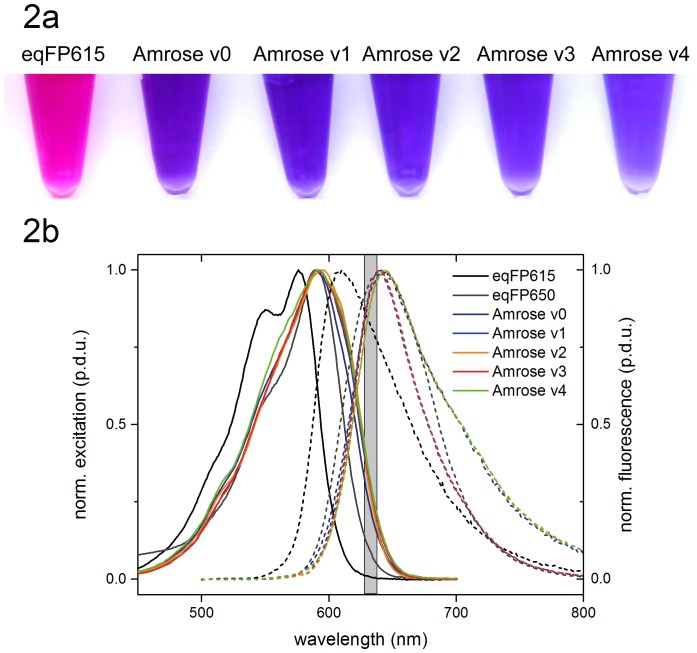
Figure 2. Spectral comparison.
Fig. 2a. Ambient light visualization of the purified E.coli produced protein showing eqFP615 and Amrose variants 0–4. Fig. 2b. Normalized excitation and fluorescence spectra of qFP615 and eqFP650 and those of the Amrose v0–v4 taken from E.coli produced purified protein using pRSETa vector (Invitrogen). Grey bar covers the red laser line at 633±4 nm; procedure defined unit = p.d.u.

