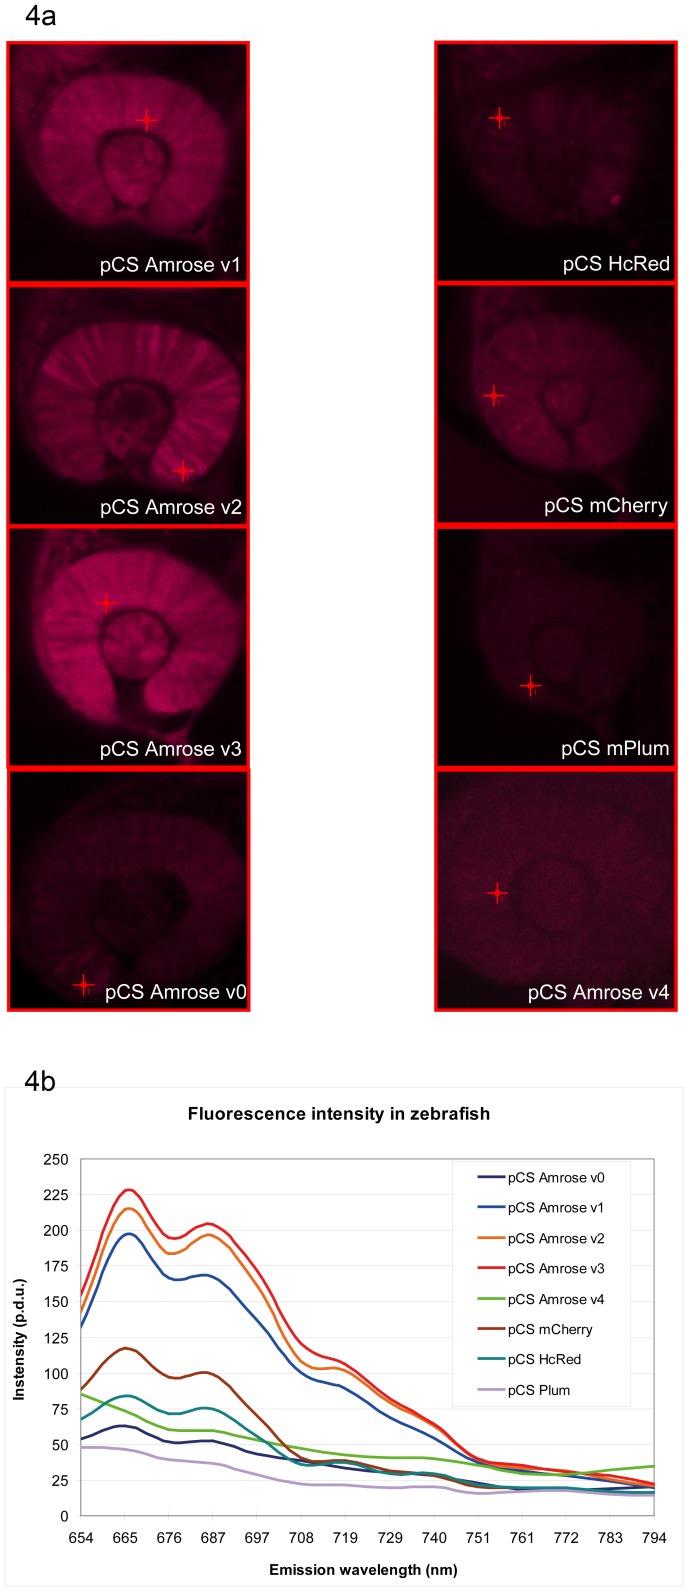
Figure 4. Comparison of Amrose variants in the zebrafish model.
Fig. 4a. Amrose v0–v4 variants, as well as HcRed, mCherry and mPlum, visualized in zebrafish 24 hours after 100 ng/µl mRNA injection using 633 nm excitation and scanning the emission spectrum. The crosshairs indicate where the measurement took place. Fig. 4b. Intensity as recorded in zebrafish (crosshairs in Fig. 4a show where measurement took place) at an excitation wavelength of 633 nm and scanned for emission at 11 nm intervals from 654 nm to 794 nm. Procedure defined unit = p.d.u.

