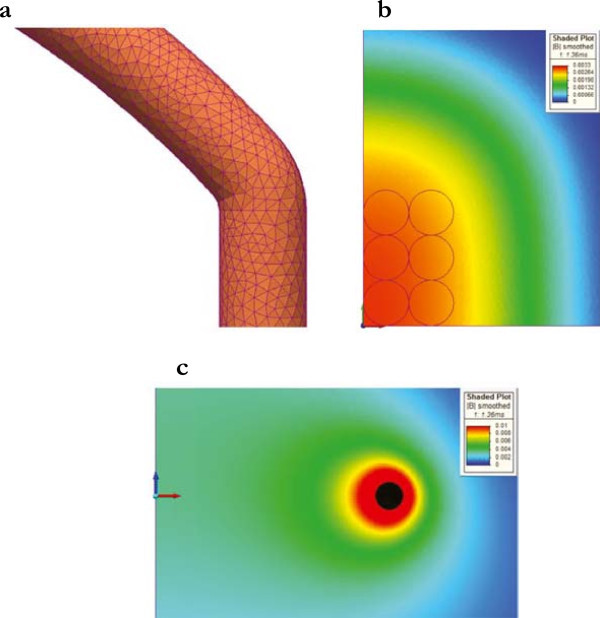
Figure 5.

Mesh and magnetic induction. (a) Detail of the coil mesh. (b) Module of the magnetic induction in the plane z = 5 cm, that is, in the central region of the electromagnetic bioreactor where the cell cultures were stimulated, and for t = 1.36 ms when the coil current was maximum (the cell cultures were placed inside wells here represented by thin black circles). In this region, the cells appeared homogeneously irradiated. (c) Module of the magnetic induction in the plane y = 0 and for t = 1.36 ms when the coil current was maximum. The coil is represented in black.
