
Figure 4. Enhanced glucose tolerance and reduced hepatic glycogen storage in liver-specific L2AKO mice.
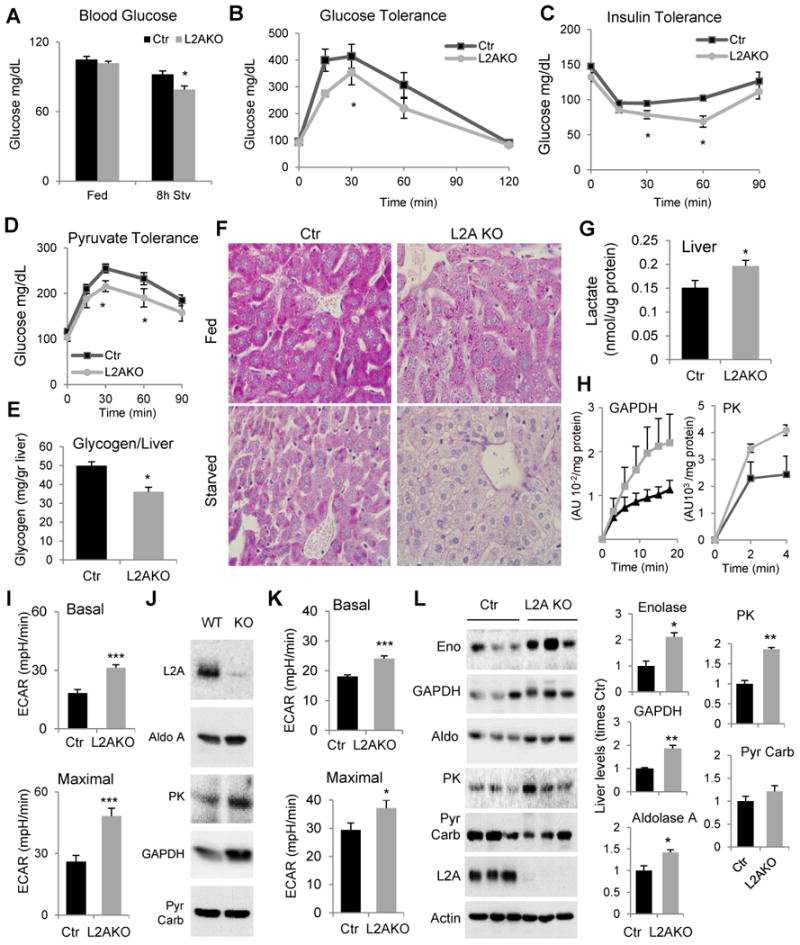
(A) Blood glucose levels in fed and 8h starved control (Ctr) and Albumin-Cre-L2Af/f (L2AKO) mice, n=6-10. (B-C) Glucose (B), insulin (C) and pyruvate tolerance (D) tests after overnight fasting, n=4-8. (E) Glycogen content in livers from normally fed mice, n=4. (F) Periodic acid-Schiff (PAS) staining of liver sections from fed and 24h starved mice (scale bar, 20 μm). (G) Liver lactate content, n=6. (H) Activity of glyceraldehyde-3-phosphate dehydrogenase and pyruvate kinase in fed mice livers (n=4). (I, K) Average extracellular acidification rates (ECAR) in primary hepatocytes from mice maintained in serum-supplemented (I) or -deprived (K) media without addition (Basal, top) or after adding 2,4 dinitrophenol (2,4 DNP) to asses inducible ECAR (Maximal, bottom). (n=6). (J) Immunoblot for the indicated enzymes in the same hepatocytes maintained in serum supplemented media. (L) Immunoblot for the indicated glycolytic enzymes in liver homogenates from 24h starved mice. Three individual mice are shown. Right: Densitometric quantification, values are expressed relative to values in Ctr mice, n=3-4. GAPDH, glyceraldehyde 3-phosphate dehydrogenase, Aldo, aldolase A; PK, pyruvate kinase; Pyr Carb., pyruvate carboxylase. All values are mean + s.e.m. Differences with Ctr were significant for * P < 0.05, ** P < 0.01, and *** P < 0.001. See also Fig. S4.