
Figure 5. CMA regulates hepatic levels of carbohydrate metabolism enzymes in response to starvation.
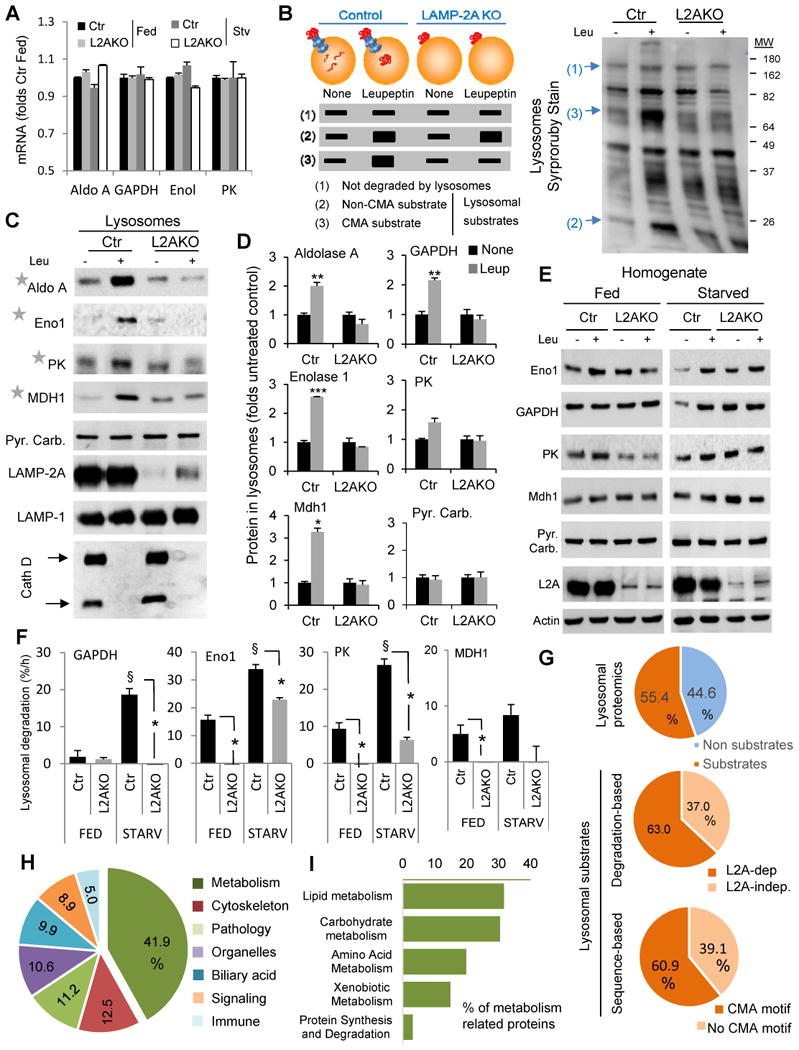
(A) mRNA levels of the indicated glycolytic enzyme genes in livers from fed or 48h starved control (Ctr) and Albumin-Cre-L2Af/f (L2AKO) mice. Values are expressed relative to Ctr fed mice, n=3. (B) Schematic of the hypothetical changes in levels of proteins in lysosomes isolated from 24h starved Ctr and L2AKO mice injected or not with leupeptin 2h before isolation. Proteins are classified depending on these changes as non-substrates (1), substrates for lysosomal degradation (2) and CMA substrates (3). Right: representative electrophoretic pattern of lysosomes isolated from animals in the indicated conditions and subjected to SDS-PAGE and SyproRuby staining. Arrows indicate examples of proteins in each of the categories indicated in the scheme. (C) Immunoblot for the indicated glycolytic enzymes in the same lysosomal samples as in B. PK, pyruvate kinase; Mdh1, malate dehydrogenase 1, cytoplasmic; Pyr. Carb., pyruvate carboxylase; Eno1, enolase 1; Cath D, cathepsin D. (D) Densitometric quantification of immunoblots as the ones shown in C and in Fig. 1J (for GAPDH). Values are expressed relative to values in untreated Ctr mice (none), n=2-5. (E) Immunoblot for the indicated enzymes of liver homogenates from fed or 24h starved mice injected or not with leupeptin. (F) Rates of lysosomal degradation of the indicated enzymes calculated by densitometric quantification of immunoblots as the ones showin in E, n=2-5. (G) Comparative proteomics of the lysosomes from the four experimental groups described in B. Percentage of proteins classified as lysosomal substrates based on their sensitivity to leupeptin (top) and percentage of CMA substrates based on: their loss of sensitivity to leupeptin in L2AKO lysosomes (middle panel) or the presence of a CMA-targeting motif in their sequence in the group of leupeptin-sensitive proteins (bottom panel), n=3. (H,I) Distribution among cellular biological processes (H) and metabolic processes (I) of proteins classified as CMA substrates in the proteomic analysis. Percentages in each group are shown, n=3. All values are mean+s.e.m. Differences with Ctr (*) or with fed (§) were significant for * § P < 0.05, ** P < 0.01, and *** P < 0.001. See also Fig. S5.