Figure 1.

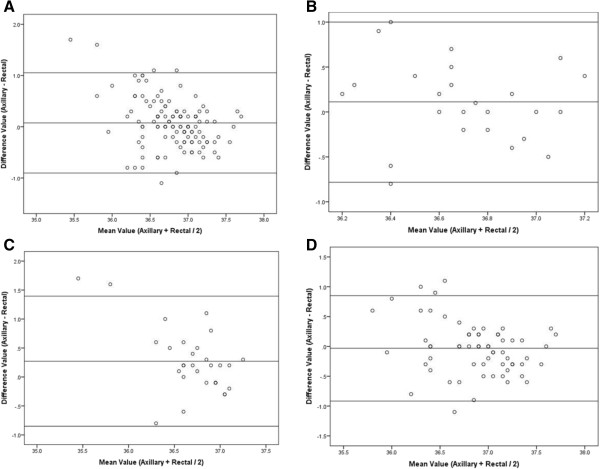
Bland-Altman plots for the entire cohort (A), 29–33 weeks gestation infants (B), 34–36 weeks gestation infants (C), and ≥ 37 weeks gestation infants (D).

Bland-Altman plots for the entire cohort (A), 29–33 weeks gestation infants (B), 34–36 weeks gestation infants (C), and ≥ 37 weeks gestation infants (D).