Figure 3.

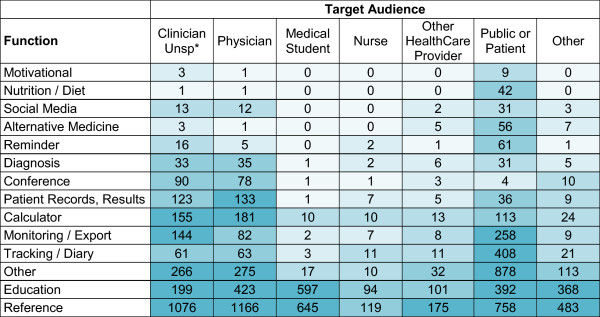
Colour-coded concentration graph of apps by function and target audience. Data are coloured by quintile. The colour intensifies as the number of apps in the quintile increases. (unsp* = unspecified).

Colour-coded concentration graph of apps by function and target audience. Data are coloured by quintile. The colour intensifies as the number of apps in the quintile increases. (unsp* = unspecified).