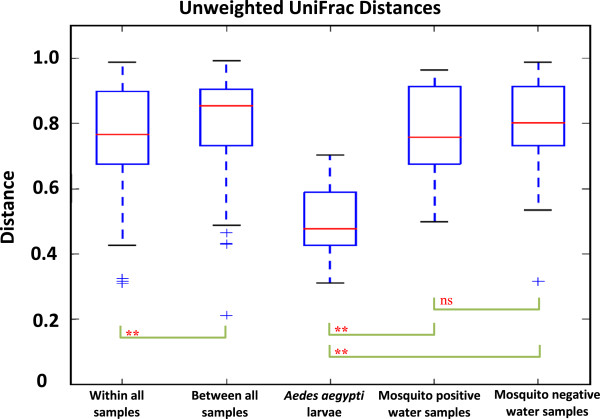
Figure 2.

Boxplots of unweighted UniFrac distances of bacterial OTUs from TTGE. Boxplots show distribution of unweighted Unifrac distances of bacterial operational taxonomic units (OTUs) within and between Ae. aegypti larvae, mosquito positive and mosquito negative water samples. Brackets show outcomes of two-sample t-test comparisons of unweighted UniFrac distances; **P < 0.01; ns, not significant.
