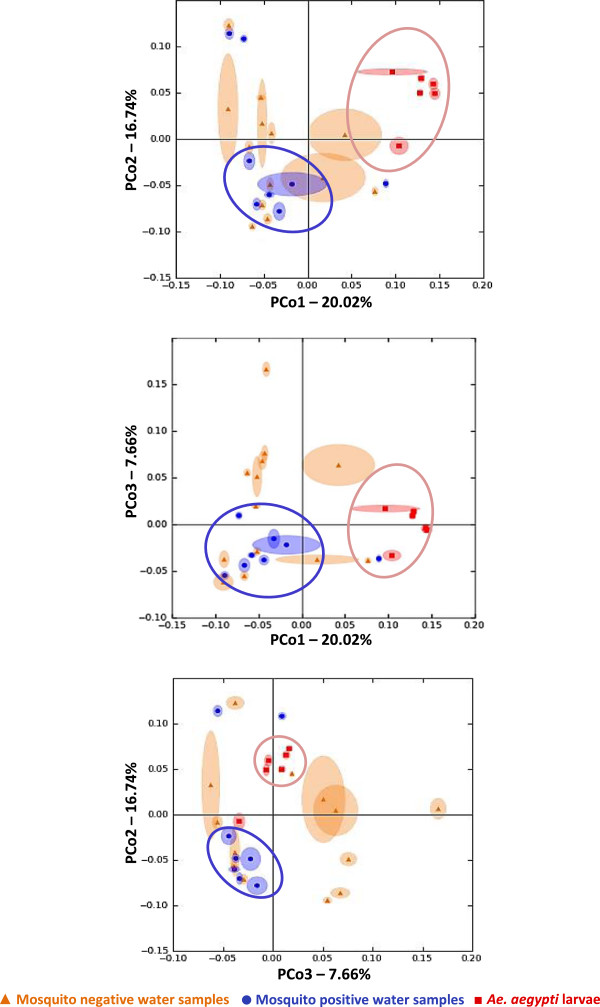
Figure 3.

PCoA of unweighted UniFrac distances between samples analyzed by TTGE. Principal coordinate analysis of unweighted UniFrac distances between Ae. aegypti larvae and water from mosquito positive and negative containers. Distinct clusters of larval samples (red) and mosquito positive water samples (blue) are captured on all three PCoA plots. Mosquito negative water samples (orange) do not show any distinct clusters on any of the plots. Each axis show percentage of variation explained. Each data point consists of a central point surrounded by ellipsoids that indicate variation in UniFrac distances from rarefaction. This demonstrates that the clustering pattern holds up to subsampling.
