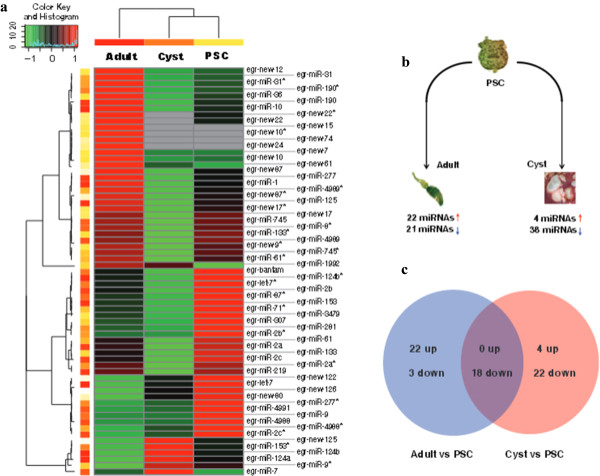
Figure 4.

Different expression profiles of miRNAs in E. granulosus . (a) Heat maps of sequencing data from 65 differentially expressed miRNAs in the three libraries. The correct P-value < 0.001 and fold-change > 2.0 were used as the threshold criteria to define significant differences in miRNA expression. MiRNA expression is displayed using a color key where green corresponds to low and red to high numbers of miRNA normalized reads. (b) Differentially expressed miRNAs through comparing the adult or cyst with the PSC. Red arrow indicates the up-regulated miRNAs, and blue arrow represents the down-regulated miRNAs. (c) The different expression patterns of miRNAs through comparing the adult or cyst with the PSC. The comparison between the adult and cyst was made and removed similar trends of miRNAs compared to the PSC.
