
Fig. 1.
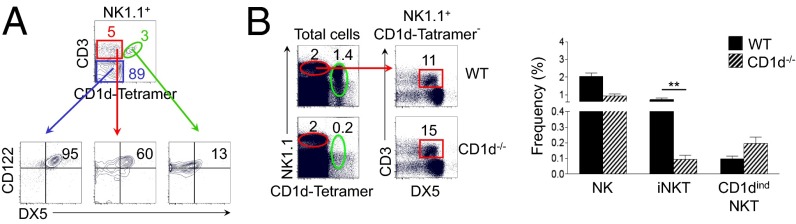
CD1dindNKT cells resemble NK cells more than iNKT cells resemble NK cells. (A) Distribution of CD3 versus CD1d tetramer among NK1.1+ cells in the spleen. Distribution of CD122 versus DX5 is shown among gated NK1.1+CD3+CD1d tetramer+ (green), NK1.1+CD3+CD1d tetramer− (red), and NK1.1+CD3−CD1d tetramer− (blue) cells. Numbers indicate the percentage of cells expressing DX5 and high levels of CD122 among each gate. (B) Distribution of NK1.1 versus CD1d tetramer in the spleen of WT and CD1d−/− mice. (B, Left) Distribution of CD3 versus CD1d tetramer is from gated NK1.1+CD1d tetramer− cells (red). (B, Right) The graph summarizes the frequency of NK (CD3−CD1d tetramer−NK1.1+DX5+), iNKT (CD3+CD1d tetramer+), and CD1dindNKT cells (CD3+CD1d tetramer−NK1.1+DX5+) in WT and CD1d−/− mice. Mean ± SEM; **P < 0.001. Data are representative of three independent experiments with n = 5 mice per experiment in A and n = 3 mice per experiment in B.