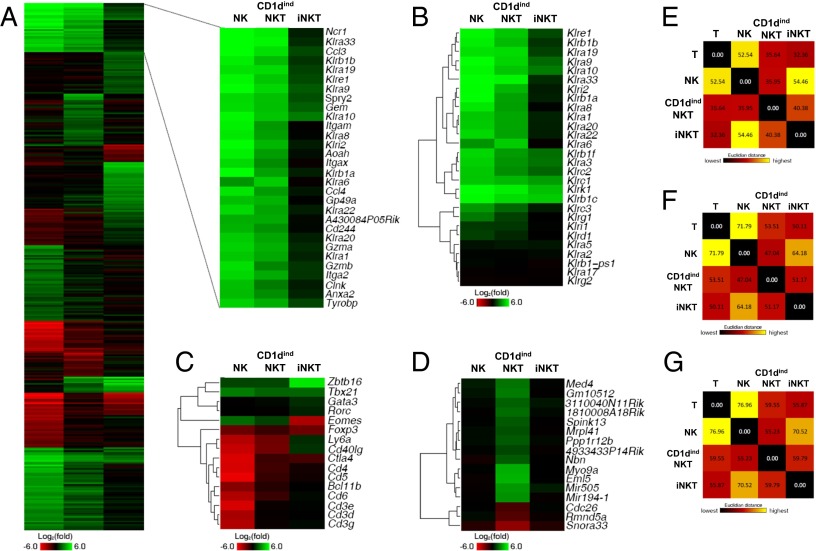
Fig. 2.
Global genome expression reveals extensive similarities between CD1dindNKT and NK cells that surpass similarities between iNKT and NK cells. (A) Splenic NK (NK1.1+DX5+CD3−CD1d tetramer−), CD1dindNKT (NK1.1+DX5+CD3+CD1d tetramer−), iNKT (NK1.1+DX5−CD3+CD1d tetramer+), and conventional T (NK1.1−DX5−CD3+CD1d tetramer−) cells were sorted, and RNA was extracted and hybridized to the mouse 1.0 ST array. Ratios were generated using normalized raw expression values and then log2 transformed. Total genes were first filtered based on an expression value of at least 16 in one of the four cell populations. Ratios of NK relative to T cells (NK/T), CD1dindNKT relative to T cells (CD1dindNKT/T), and iNKT relative to T cells (iNKT/T) were compared, and the genes that did not have a larger than twofold change in at least one of the three ratios were filtered out. The remaining genes were ranked by the SD of the three values, and k-means (k = 15) clustering was performed in the top 20%. The blowout shows two clusters of genes with higher differential expression in NK/T and CD1dindNKT/T but not in iNKT/T cells. (B) Heat map of hierarchical clustering of the killer cell lectin-like (Ly49) family of receptors. (C) Heat map of hierarchical clustering of various selected genes commonly found in T cells. (D) Heat map showing genes that are selectively up-regulated or down-regulated (more than twofold) in CD1dindNKT but not in NK or iNKT cells (less than twofold) relative to T cells. We subtracted the absolute expression change values in NK and iNKT from the values in CD1dindNKT, sorted the selected genes by this value from high to low, and displayed the top 16 genes as a heat map. A more complete set of genes is shown in Fig. S7. Colors indicate up-regulation (green) and down-regulation (red) relative to T cells. (E–G) Pair-wise Euclidean distance of expression levels between NK, CD1dindNKT, iNKT, and T-cell subsets. E shows the same selected set of genes shown in A, F shows genes with at least twofold differential expression in at least one of these cell subsets, and G shows all expressed genes (with expression levels higher than 16). Colors indicate long (yellow) and short (dark red) distance. Gene chip data are from cell subsets sorted from n = 7 mice.

