Fig. 3.
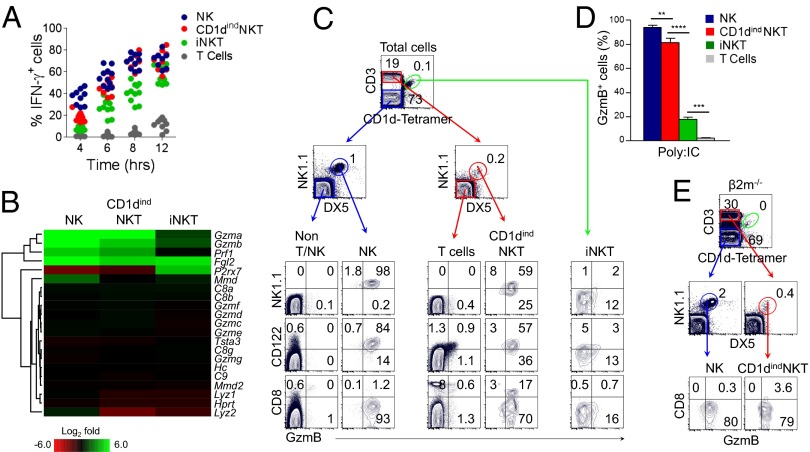
CD1dindNKT cells are endowed with a unique hybrid function. (A) Splenocytes from WT mice were stimulated with IL-12 (5 ng/mL) and IL-18 (25 ng/mL) for 4–12 h. Graph shows the intracellular expression of IFNγ among non-T/NK cell gate (CD3−CD1d tetramer−NK1.1−DX5−), NK cells (CD3−CD1d tetramer−NK1.1+DX5+), T cells (CD3+CD1d tetramer−NK1.1−DX5−), CD1dindNKT cells (CD3+CD1d tetramer−NK1.1+DX5+), and iNKT cells (CD3+CD1d tetramer+) as a function of time. Data are representative of three independent experiments with n = 3–5 mice per experiment. Graph shows individual mice. (B) Heat map shows the defined Gene Ontology (GO) pathway of cytolysis (GO 0019835) in NK, CD1dindNKT, and iNKT cells. Colors indicate up-regulation (green) and down-regulation (red) relative to T cells. Results are from cell subsets sorted from n = 7 mice. (C–E) Intracellular expression of granzyme B (GzmB) from Poly:IC-treated WT (C and D) or β2m−/− (E) mice. (C) Plots show the distribution of GzmB versus NK1.1, CD122 and CD8 among non-T/NK, NK, T, CD1dindNKT, and iNKT cells. (D) Graph summarizes the frequency of GzmB-expressing cells among splenic NK, CD1dindNKT, iNKT, and T-cell subsets 16 h after in vivo Poly:IC treatment. Mean ± SEM; **P < 0.001, ***P < 0.0001, ****P < 0.00001. (E) Plots show the distribution of GzmB versus CD8 among splenic NK and CD1dindNKT cells from Poly:IC-treated β2m−/− mice. Data are representative of three (C and D) and two (E) independent experiments with n = 4 Poly:IC-treated mice per experiment.

