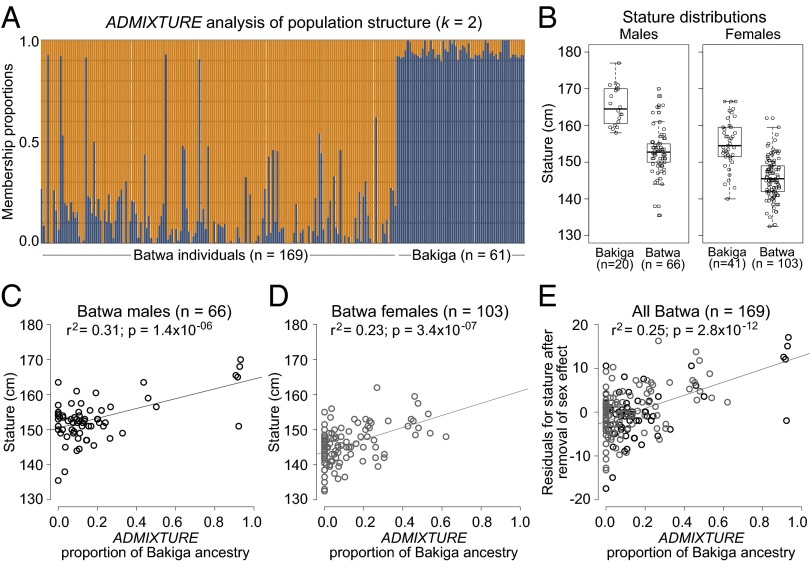
Fig. 2.
Batwa and Bakiga admixture and stature. (A) Population structure analysis based on autosomal SNPs. Each individual is represented as a vertical line, with population origins indicated below the lines. Cluster membership proportions are depicted in orange (inferred proportion of Batwa ancestry) and blue (inferred proportion of Bakiga ancestry). (B) Boxplots of Batwa and Bakiga male and female stature estimates. (C–E) Relationships between Bakiga ancestry and stature for (C) Batwa males, (D) Batwa females, and (E) all Batwa individuals after regressing out the sex effect from the stature estimate.

