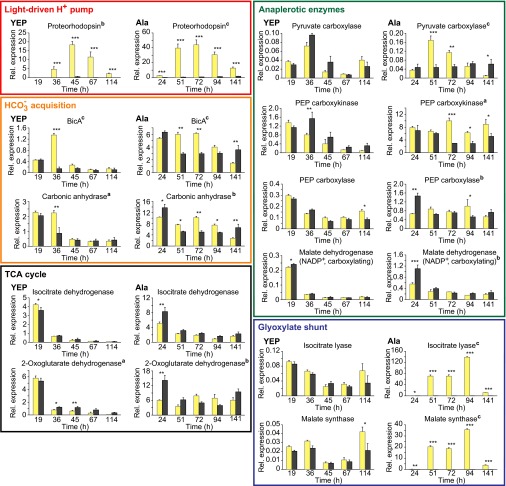
Fig. 3.
Relative gene expression patterns in Dokdonia sp. MED134 of proteorhodopsin, HCO3−-acquisition, TCA cycle, anaplerotic enzyme, and glyoxylate shunt genes during growth in artificial seawater with YEP and Ala. Responses in the light (yellow columns) and in darkness (dark gray columns). qPCR was performed at the time points marked with arrows in Fig. 1. Relative gene-specific expression values were obtained by normalization to the expression levels of the housekeeping genes rpoD and recA. Error bars denote SE of triplicate biological replicates. Superscript letters after gene product names denote significance levels (aP < 0.05, bP < 0.01, cP < 0.001) of differences in gene expression in light or darkness changing over time, as determined by repeated-measures ANOVA. Asterisks denote significance levels (*P < 0.05, **P < 0.01, ***P < 0.001) of differences in gene expression between light and darkness at specific time points, as determined by Fisher’s LSD test. For statistical analysis of changes in expression levels over time within light treatment or in darkness, see Table S1.

