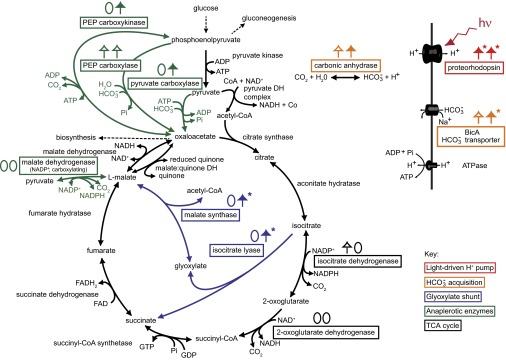
Fig. 4.

Central metabolic pathways and bicarbonate acquisition enzymes associated with proteorhodopsin phototrophy in Dokdonia sp. MED134. Colored squares denote enzymes for which relative gene expression analyses were carried out on the corresponding genes. For each analyzed gene, light responses in Fig. 3 are summarized as pairs of zeros and/or up-facing arrows in seawater with YEP (left in pair) and Ala (right in pair). Closed arrows denote genes with significantly higher relative expression levels in the light at two or more consecutive time points. Open arrows denote genes with significantly higher expression levels in the light at single or nonconsecutive times only. Asterisks denote gene expression responses reaching greater than fivefold higher levels in the light. Adapted and expanded from González et al. (26).
