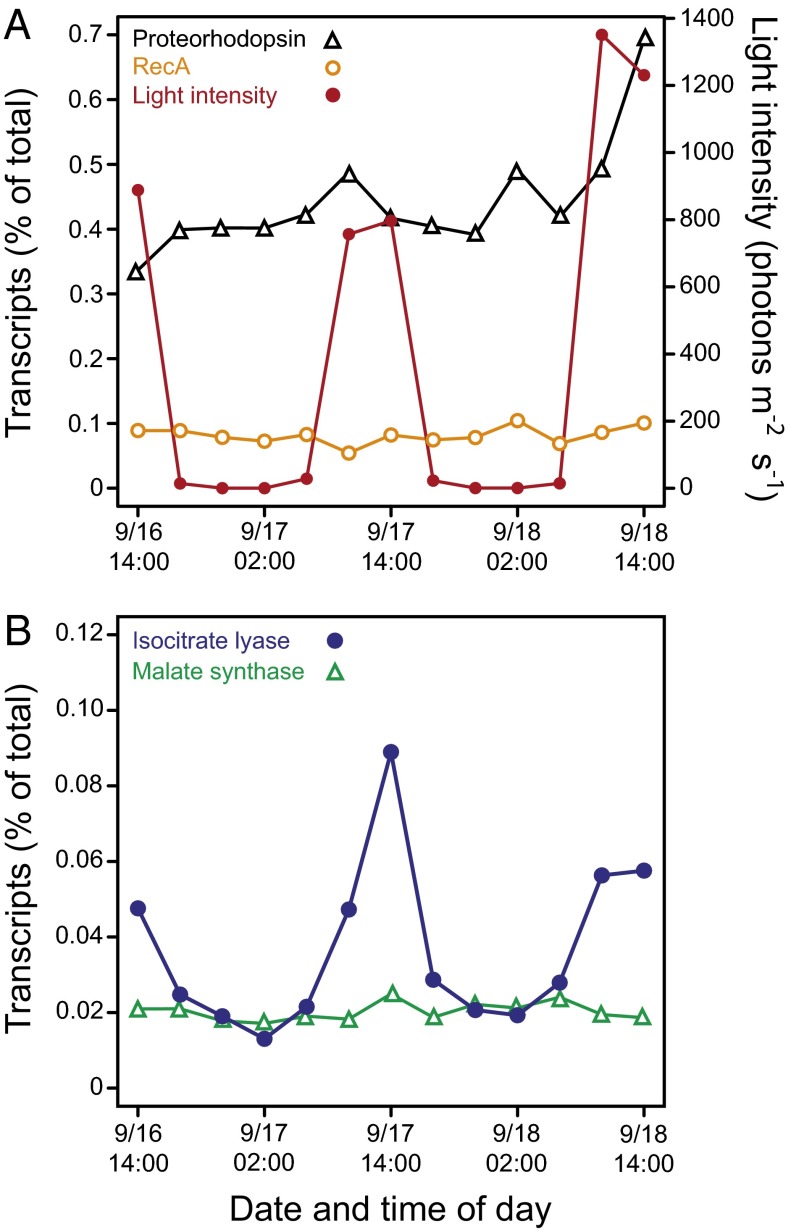
Fig. 5.
Bacterioplankton community dynamics in selected gene expression patterns in the Pacific off Monterey Bay. Dynamics in relative expression levels of (A) the genes encoding proteorhodopsin and RecA compared with light intensity and (B) genes encoding isocitrate lyase and malate synthase. Figure based on gene-specific analyses of metatranscriptome data obtained from natural seawater and reported by Ottesen et al. (30). Percent of total transcripts in metatranscriptome were obtained by BLASTX against RefSeq.

