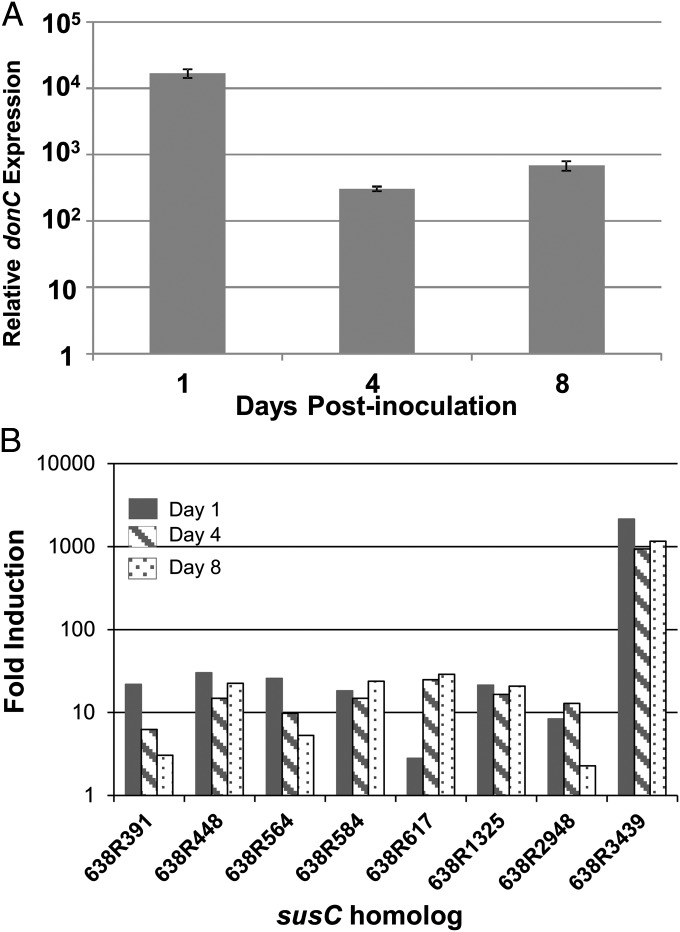
Fig. 1.
In vivo PUL gene expression during growth in the rat tissue cage model. Samples for analyses were pooled from five animals 1, 4, and 8 d postinoculation. (A) Expression of donC in samples from the rat tissue cage relative to midlogarithmic cultures grown in DM–glucose. Expression was measured in triplicate samples by qRT-PCR and normalized to the amount of 16S rRNA. Values are shown with SDs. (B) Induction of SusC homologs during growth in vivo relative to DM–glucose. Shown are the highly induced in vivo susC-like genes associated with PULs in cluster 1. Clusters were determined from expression microarray data analyzed by k-means clustering using the standard Pearson’s correlation coefficient distance metric. All induction values were significant at P < 0.01.

