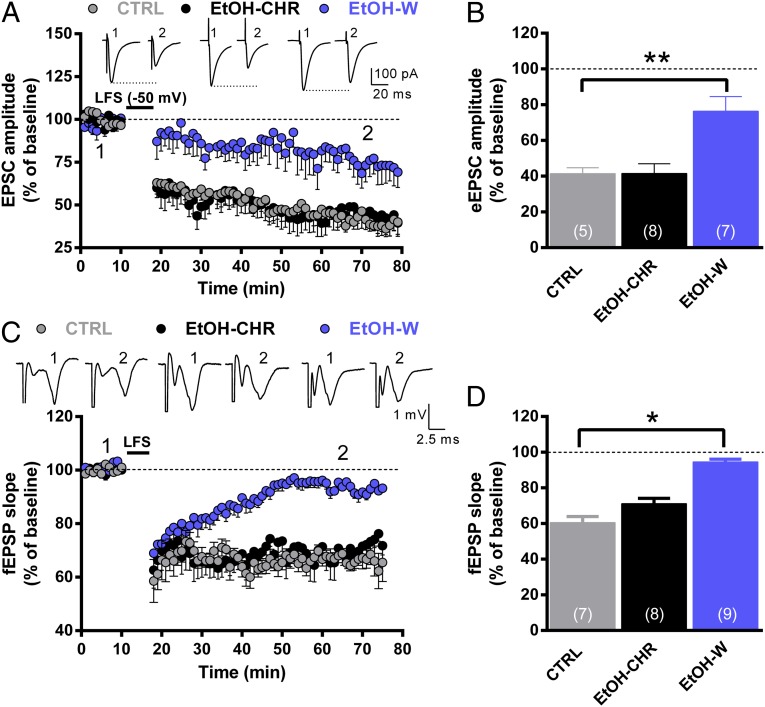
Fig. 7.
Effect of chronic ethanol treatment and withdrawal on LTD induced in Nacc MSNs. (A) AMPAr-mediated EPSCs were recorded in single voltage-clamped (−65 mV) MSNs of the Nacc shell obtained from the different groups of animals. Representative EPSCs recorded before (1) and after (2) conditioning are shown above the graph. (B) The graph illustrates the degree of LTD, calculated by averaging the percent change in EPSC amplitude from baseline 70–80 min after LFS. The number of cells analyzed is indicated in each bar. **P < 0.01 vs. CTRL. (C) Field EPSPs were recorded in Nacc shell slices obtained from the different groups of rats. LTD was elicited by LFS (500 stimuli at 1 Hz), and representative traces are shown above the graph. Data are expressed as mean percent change in fEPSP slope ± SEM from baseline. (D) The graph summarizes the degree of LTD, calculated by averaging the percentage change in fEPSP slope from baseline 70–80 min after LFS. The number of recordings analyzed is indicated in each bar. *P < 0.05 vs. CTRL.

