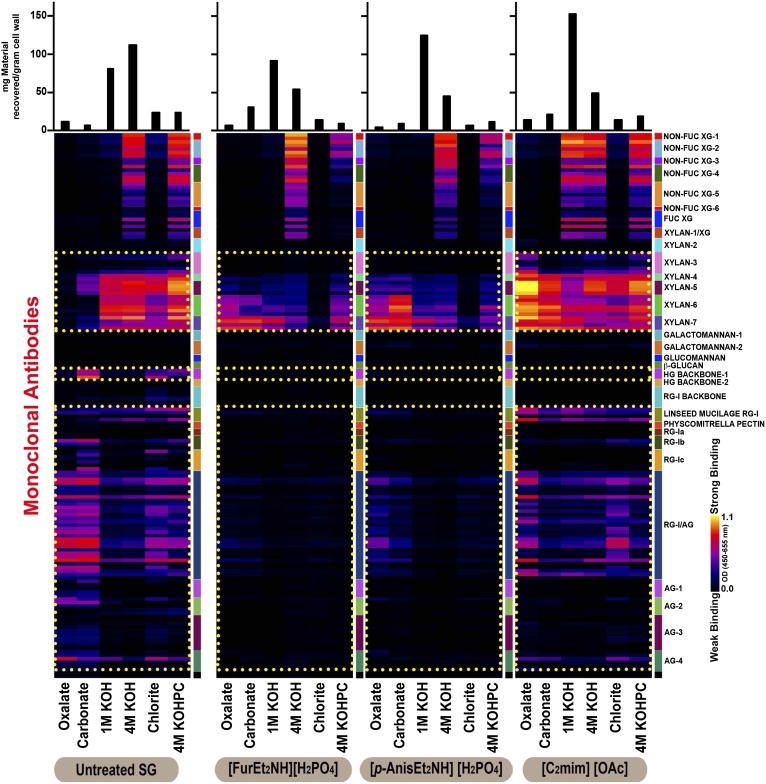
Fig. 6.
Glycome profiling of untreated switchgrass (SG), and switchgrass pretreated with ILs [FurEt2NH][H2PO4] (1), [p-AnisEt2NH][H2PO4] (3), and [C2mim][OAc] (4): Sequential cell wall extracts (Bottom) were subjected to ELISA screens with monoclonal antibodies for most major noncellulosic plant glycan classes (Right). The ELISA binding response values are represented as a color-coded heat map (Center), and the recovered masses of carbohydrate material resulting from each extraction step is represented with bar graphs (Top).

