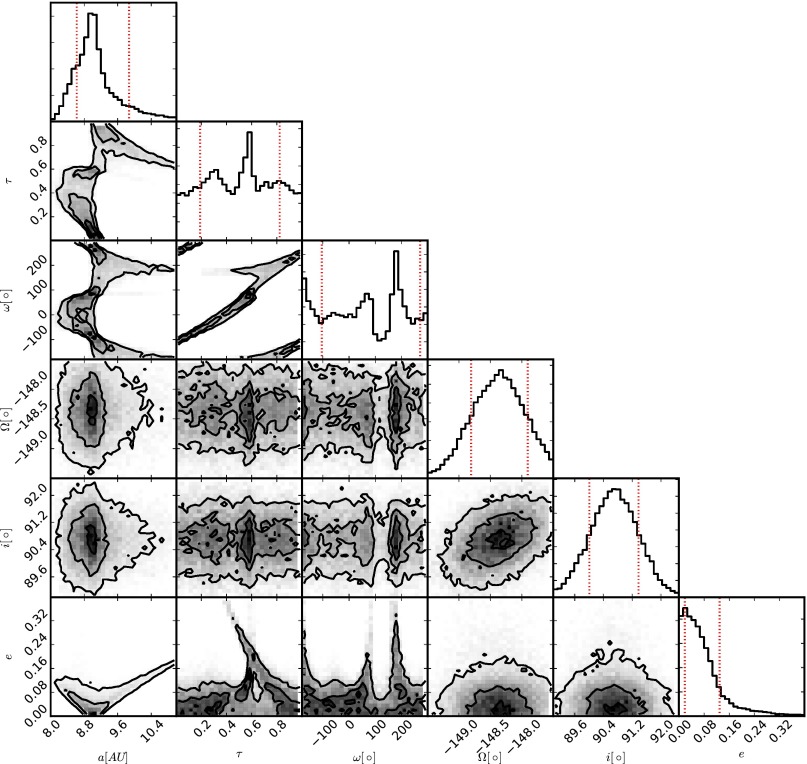
Fig. 5.
Posterior distribution of the orbital elements of β Pic b: semimajor axis, a; epoch of periapse, τ (in units of the orbital period); argument of periapse, ω; argument of the ascending node, Ω; inclination, i; and eccentricity, e. The plot shows the joint distributions as contours (0.1, 0.5, and 0.9) and marginalized probability density functions as histograms. The well-represented degeneracy in ω, e.g., see ω versus a, is good evidence of reliable sampling of the posterior distribution. Vertical dotted lines in the histograms denote the 68% confidence interval.

