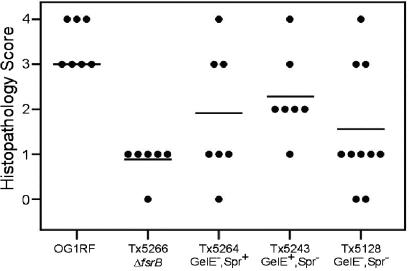
FIG. 4.
Histopathological results. Numerical scores ranging from 0 (normal) to 4 (most severe) were assigned to each slide according to a standardized grading system. The mean was significantly higher for the OG1RF-infected group than for the mutant-infected groups (P < 0.02). The apparent differences between the means for individual mutants are not statistically significant.

