
Fig. 1.
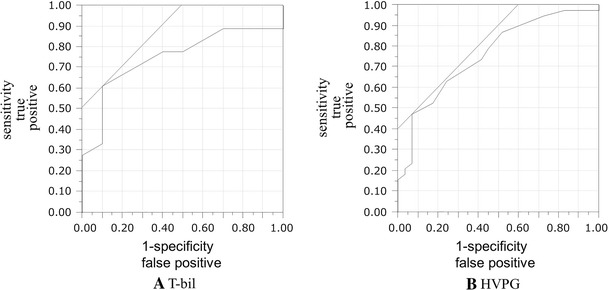
ROC curves for T-bil (A) and HVPG (B) were used to determine the cutoff values yielding the highest combined sensitivity and specificity with respect to aggravation of EV. Those points were 1.6 mg/dL for T-bil and 13 mmHg for HVPG, and areas under the ROC curve were 0.76 and 0.75, respectively. ROC receiver operating characteristic, T-bil total bilirubin, EV esophageal varices, HVPG hepatic venous pressure gradient