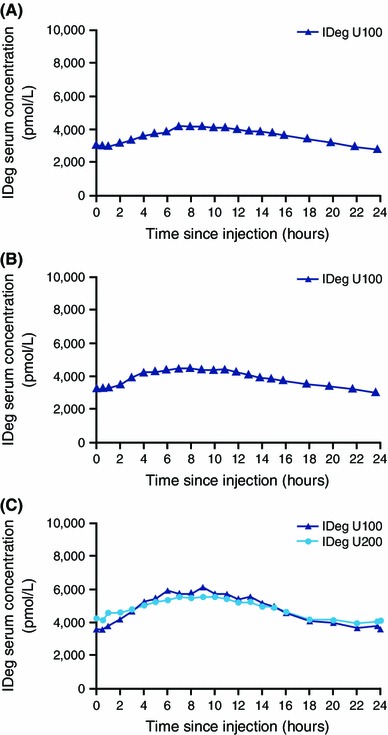
Fig. 3.

Concentration–time profiles of insulin degludec 100 U/mL (IDeg U100) dosed at 0.4 U/kg in subjects with a type 1 diabetes mellitus [34] or b type 2 diabetes (data taken from Heise et al. [21]). Also shown are the concentration–time profiles for c IDeg U100 and IDeg 200 U/mL (IDeg U200) dosed at 0.4 U/kg in subjects with type 1 diabetes [reproduced from Korsatko et al. [20], Fig. 2a, p. 518], with kind permission from Springer Science + Business Media)
