
Fig. 6.
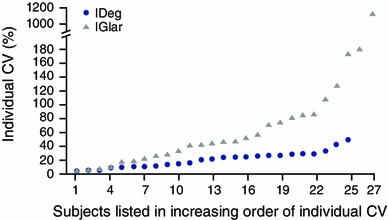
Subject-specific day-to-day variability in the area under the glucose infusion rate curve for insulin degludec (IDeg) or insulin glargine (IGlar) dosed at 0.4 U/kg during one dosing interval (0–24 h) at steady state (reproduced from Heise et al. [22], with permission from John Wiley and Sons, Inc.). CV coefficient of variation