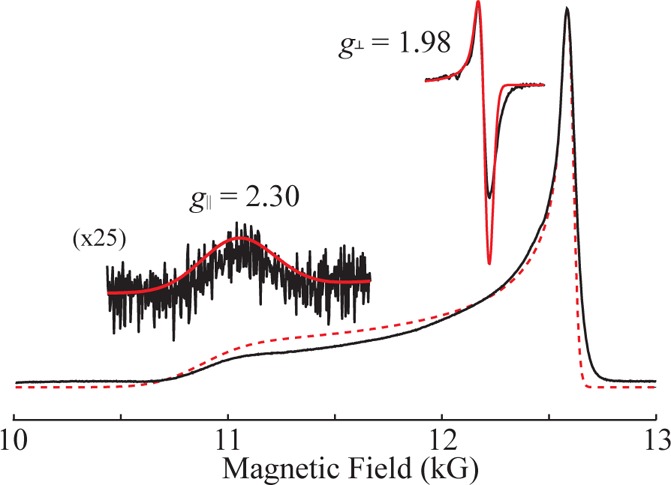
Figure 2.

“Q-band” absorption-like ESE-EPR spectra of 50% 15N labeled FeV nitride complex in frozen 2-methyltetrahydrofuran is shown in black with respective simulation in red. Simulations of an axial g, g∥ = 2.30 and g⊥ = 1.98, with EPR line widths (measured at fwhm) of 460 and 50 G, respectively, matches the observed EPR spectrum. Insets are of the numerical derivative of observed spectrum, black, and the scaled simulations of each axial feature, red. Conditions: Hahn echo; 2 K; microwave freq, 34.975 GHz; 20 ms repetition time; τ, 500 ns; scan time, 500 s.
