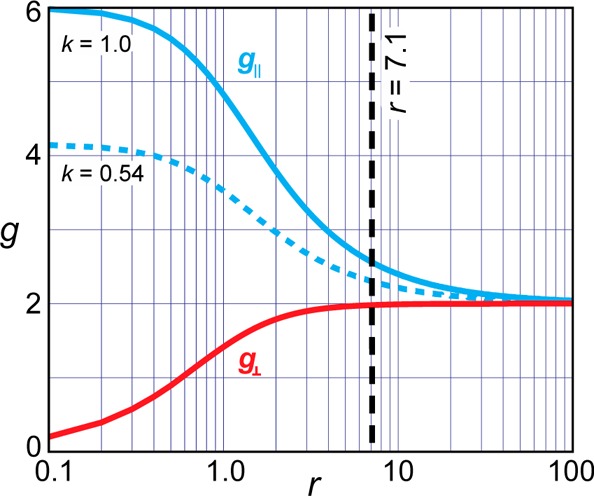
Figure 4.

Plot of g values for the [e]3 configuration as a function of r (eq 4). The solid blue line represents the crystal-field limit, k = 1; dashed blue represents measured k = 46%; the vertical black dashed line indicates the solved r = 7.1 for g∥ = 2.30 and g⊥ = 1.98.
