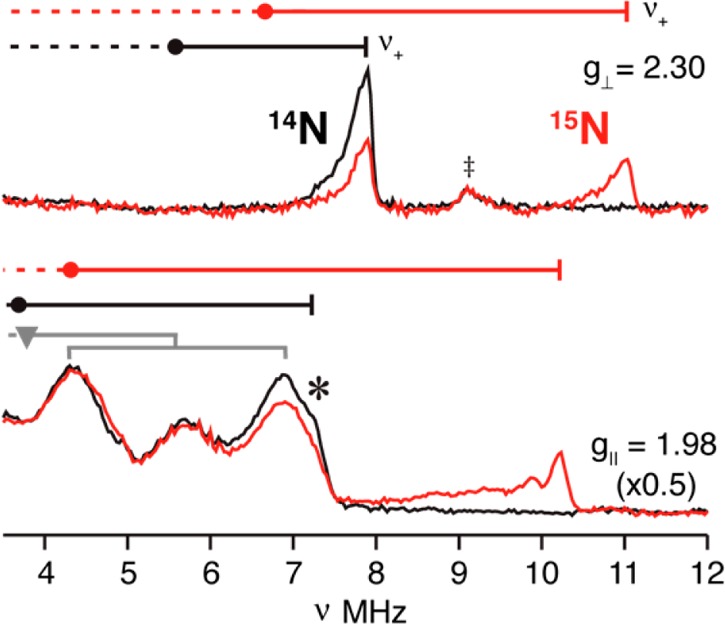
Figure 6.

14/15N ENDOR spectra of 1 collected at g∥ and g⊥: black, 14N nitride; red, 50% isotopically 15N-enriched nitride. 15N hyperfine couplings associated with g∥ and the maximum value at g⊥ were calculated the nu+ frequencies, Ag∥(15N) = 12.8, Ag⊥,max(15N) = 9.6 MHz. The frequencies of the corresponding 14N v+ features match the frequencies calculated by scaling the 15N hyperfine couplings with the ratio of the nuclear g values, Ag∥(14N) = 12.8, Ag⊥,max(14N) = 9.6 MHz and assuming the absence of a quadrupole splitting in the 14N spectrum (see text). Circles correspond to the hyperfine frequencies (A(14,15N)/2); goalposts indicate splittings by the corresponding nuclear Larmor frequencies. Gray goalposts (g = 1.98) represent hyperfine and quadrupole splitting for 14N of the tripodal ligand (see Figure S2). (‡) indicates the 1H line excited by the fifth rf harmonic.
