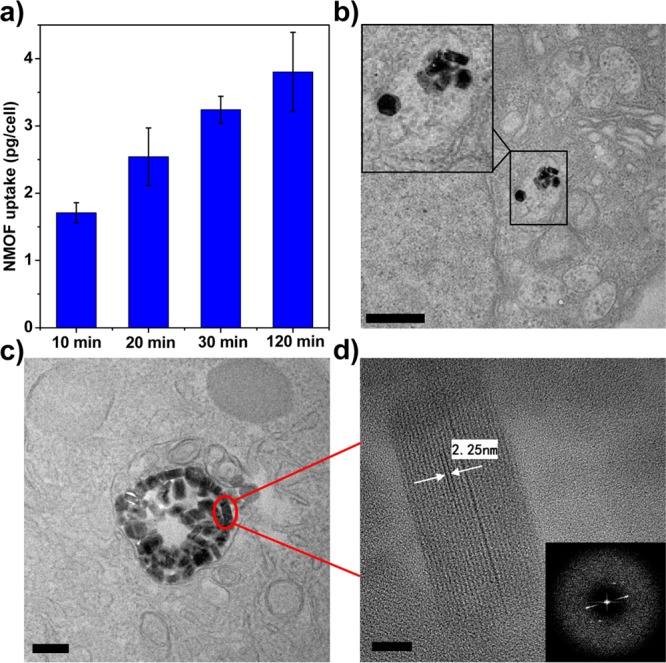
Figure 3.

Cellular uptake and intracellular distribution of F-UiO in H460 cells. (a) Time-dependent cellular uptake of F-UiO in H460 cells determined by ICP-MS. (b–d) High-resolution TEM image showing the distribution and structural integrity of UiO NMOFs in the endosomes. Inset in (b) is a zoomed-in view showing the UiO inside one endosome. (d) Zoomed-in view showing the UiO NMOF marked by red circle in (c). Inset in (d) is the FFT image showing the electron diffraction pattern of (d). Bar represents 600, 200, and 20 nm in (b)–(d), respectively.
