
Figure 4.
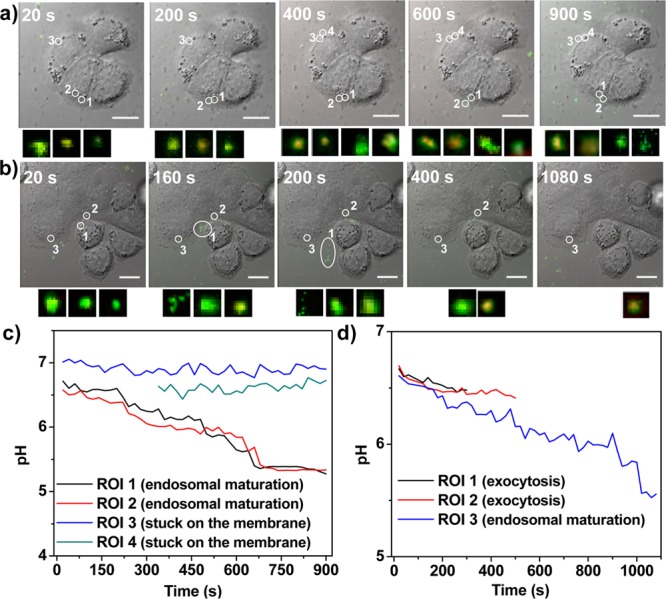
Time relapse pH changes in individual endosomes. (a,b) CLSM images shown are overlays of DIC, green (488 nm excitation), and red (435 nm excitation). Each ROI was labeled with white circle and number. Small images showing under each CLSM image are zoomed-in views of overlays of green (488 nm excitation) and red (435 nm excitation) for each ROI. The small images represent ROI 1 to ROI 4 (a, video 1 in SI) or ROI 1 to ROI 3 (b, video 2 in SI) from left to right. Bar: 10 μm. (c,d) The pH evolution curve of each ROI was obtained by fitting the I488/520/I435/520 with the calibration curve. (c) and (d) were generated from (a) and (b), respectively.