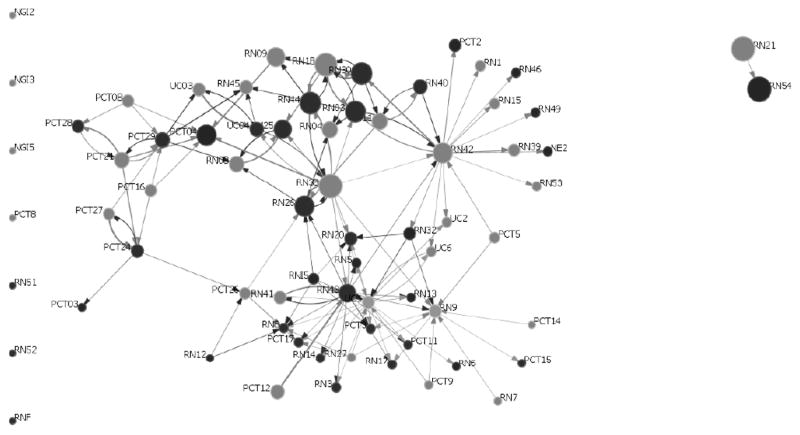
Figure 2.
The Handoff Network for Unit 5. Gray nodes = Day Shift; Black nodes = Evening or Night Shift. Communication frequency is mapped onto link width (more frequent communication = wider links). Larger node size represents higher Eigenvector Centrality values. Seven isolates (three new graduates, Two RNs, 1 Floated RN, and a PCT) are shown along the left border. See text for details.
[NOTE: Supplemental Digital Content 1 was deleted by editorial office as it is not appropriate for inclusion. Please renumber the following if necessary.]

